
Getting a raise should feel like progress. But for many workers, wages are falling behind rent more than ever — since 2019, rents nationally have jumped 34%, while wages only increased by 27% over the same period. Meanwhile, over 12 million U.S. households now spend at least half their income on rent and utilities, placing them in “severely cost-burdened” territory. In this study, we analyzed average wage growth from 2023 to 2024 and from 2019 to 2024 using Bureau of Labor Statistics (BLS) data, and matched it against Zillow’s Observed Rent Index for the same time periods to show where rent hikes are outpacing wage growth — and by how many percentage points.
This study aligns with United Way NCA’s mission to promote economic equity by spotlighting where working individuals, especially ALICE (Asset Limited, Income Constrained, Employed) households, are still set up to fall behind despite wage growth. It shows that even with pay increases, basic needs like housing remain out of reach for many, an issue at the heart of United Way’s efforts to close the income gap.
Read on to see where affordability stress is highest and where interventions can matter most.
Key Findings
- The Northeast faces the sharpest affordability crisis, claiming nearly half of the top 25 metro areas where rent growth outpaces wages — including three metros in Connecticut, New Haven, Hartford, and Bridgeport, which all rank in the top 10.
- In contrast, several Texas metros, led by Austin, saw wages climb while rents declined, signaling that some Southern markets are slowly regaining balance.
- Knoxville, Tennessee, has the steepest five-year disparity since COVID-19, with rent up 60% between 2019 and 2024 and wages up 27%, creating a 34-point gap — the widest in the country.
- Washington, D.C., ranks 11th among metro areas where rent is rising faster than wages. D.C. saw rent rise 4.55% between 2023 and 2024 and wages rise 2.31% — a 2.25-point gap — revealing that even in high-income regions like the National Capital Area, pay raises aren’t always enough to offset steep rent increases.
Where Rent Hikes Are Outpacing Wage Growth Around the U.S.
Top metros with the widest 1-year rent–wage growth gaps (2023–2024):
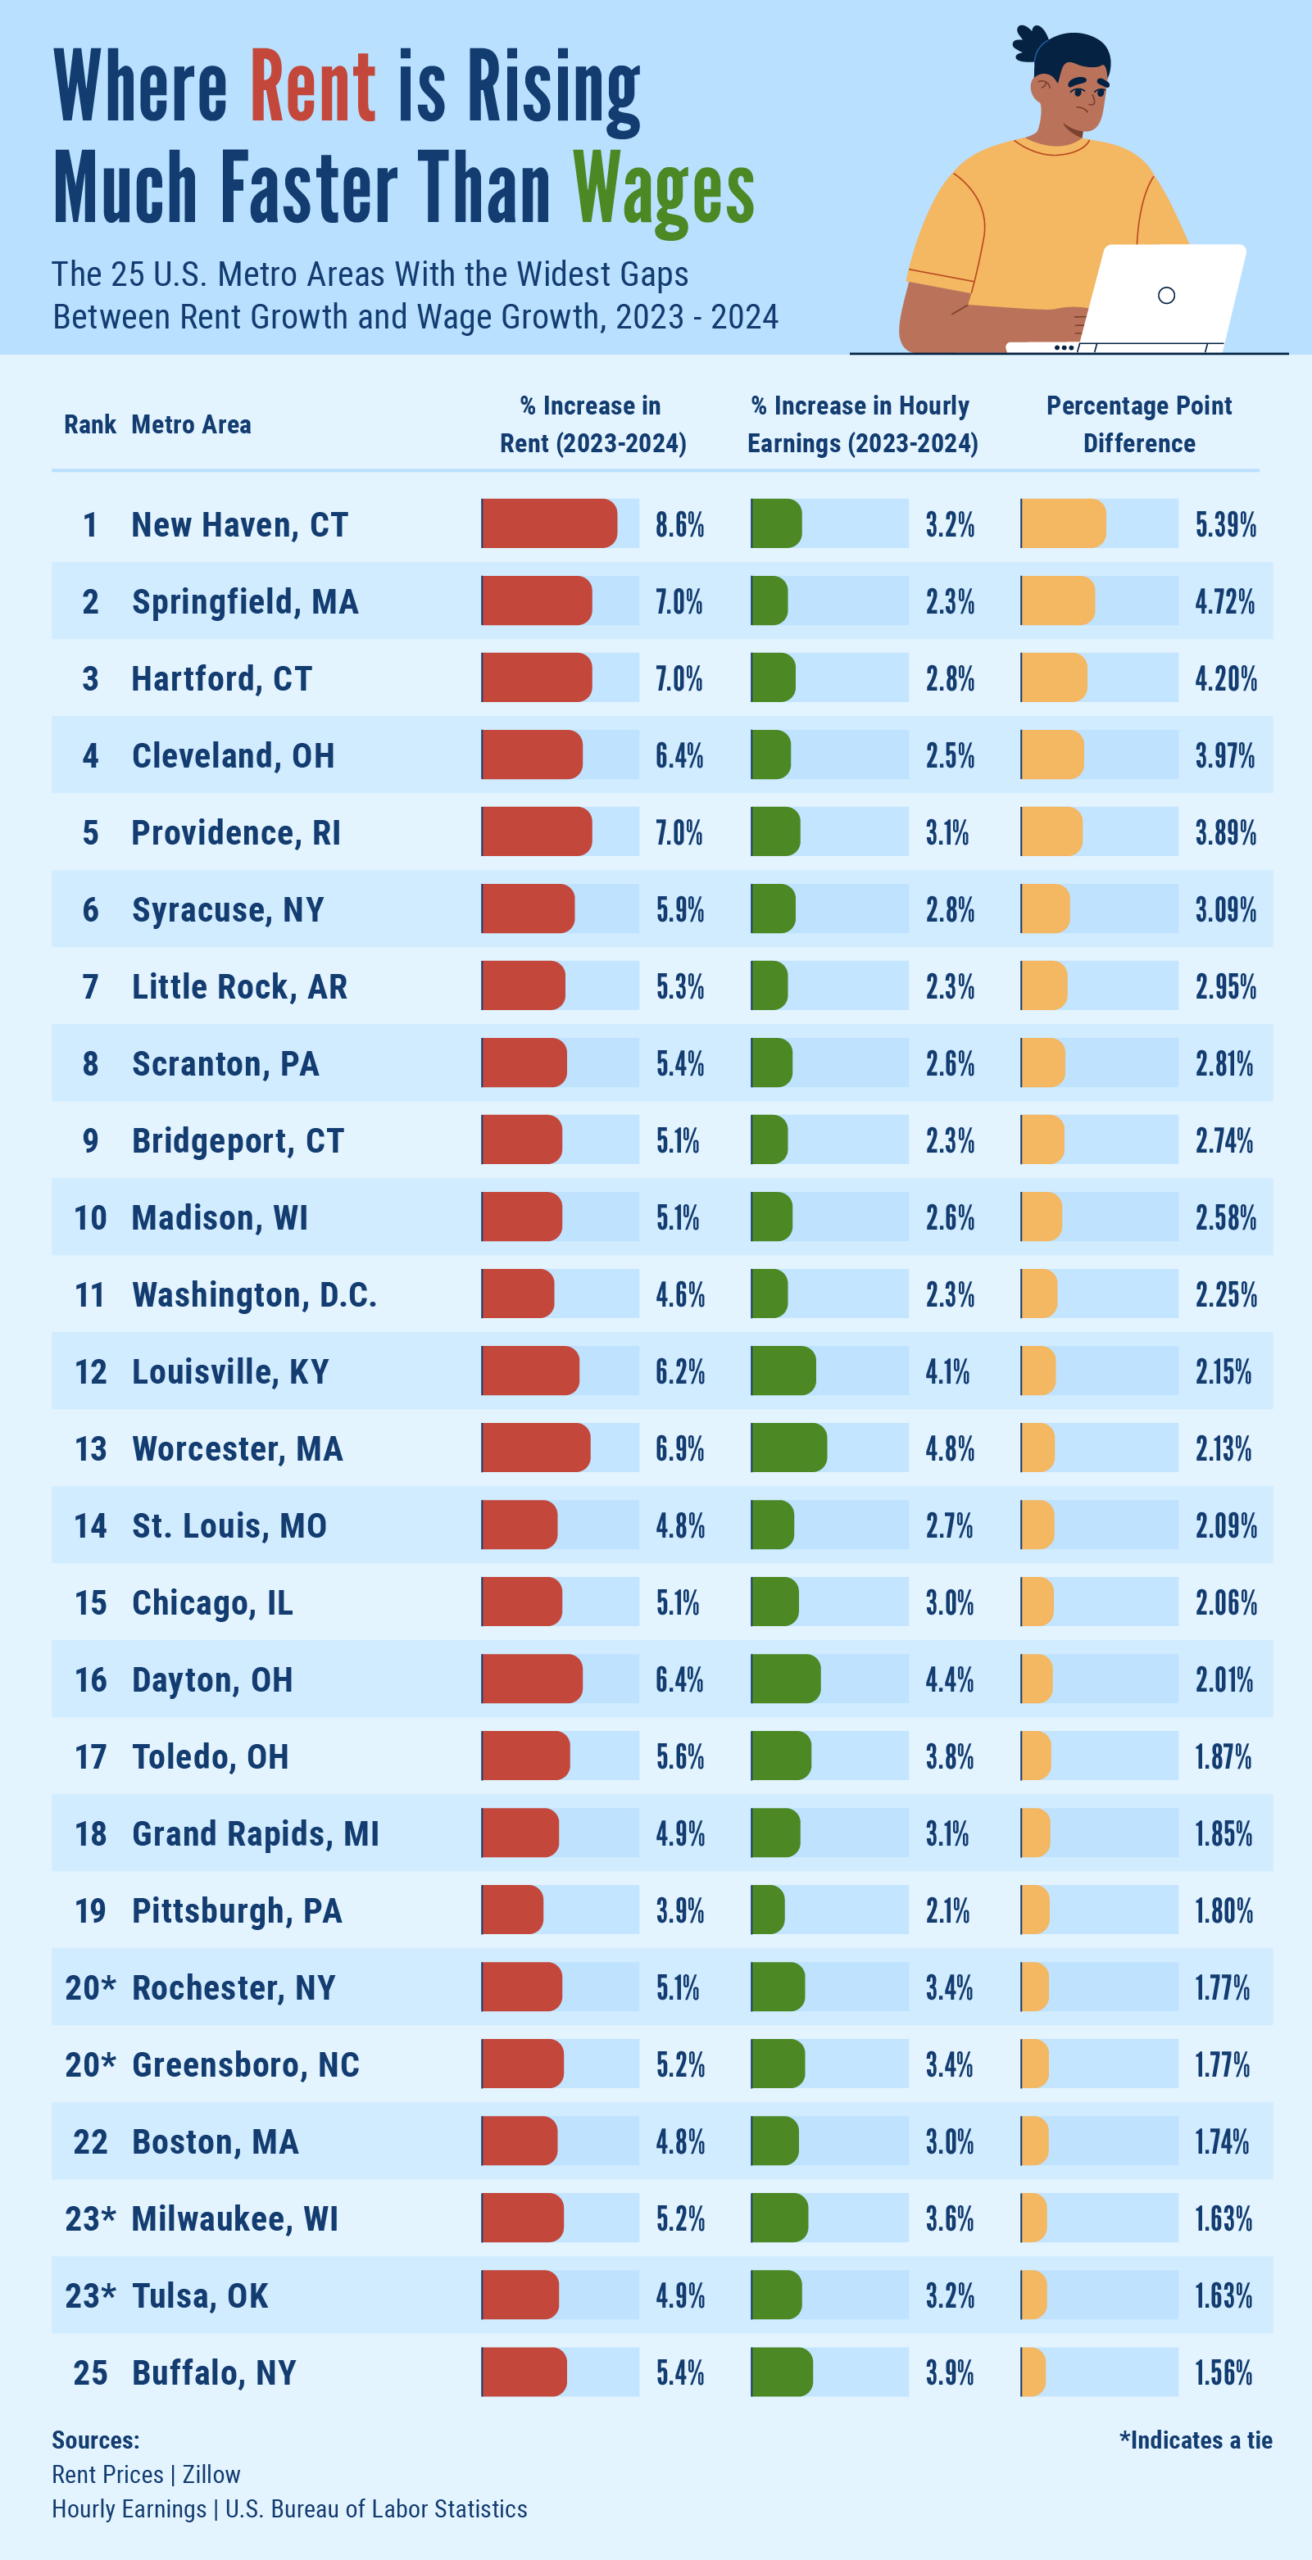
- New Haven, Connecticut — rent +8.61%, wages +3.22% (+5.39 pts)
- Springfield, Massachusetts — rent +7.04%, wages +2.32% (+4.72 pts)
- Hartford, Connecticut — rent +6.99%, wages +2.79% (+4.20 pts)
- Cleveland, Ohio — rent +6.44%, wages +2.47% (+3.97 pts)
- Providence, Rhode Island — rent +7.03%, wages +3.14% (+3.89 pts)
- Syracuse, New York — rent +5.93%, wages +2.84% (+3.09 pts)
- Little Rock, Arkansas — rent +5.29%, wages +2.34% (+2.95 pts)
- Scranton, Pennsylvania — rent +5.44%, wages +2.62% (+2.81 pts)
- Bridgeport, Connecticut — rent +5.07%, wages +2.33% (+2.74 pts)
- Madison, Wisconsin — rent +5.13%, wages +2.55% (+2.58 pts)
- Washington, D.C. — rent +4.55%, wages +2.31% (+2.25 pts)
Nearly half of the top 25 metro areas are in the Northeast (12 of 25), led by Connecticut, which places three metros in the top ten — New Haven, Hartford, and Bridgeport. Massachusetts, New York, and Ohio each contribute three metros to the top twenty-five, signaling an affordability crunch across these states.
In New Haven, Connecticut, the average rent rose from $1,889 in 2023 to $2,052 in 2024 — an 8.6% increase. Meanwhile, the average hourly wage increased from $34.20 to $35.30 (up 3.2%), creating a 5.4-point gap where rent growth continues to outpace earnings.
While most of the top-ranked metros are mid-sized or secondary markets, several large markets also appear — including our own Washington, D.C. (+2.25 pts), Chicago, Illinois (+2.06 pts), and Boston, Massachusetts (+1.74 pts). Washington, D.C.’s average rent rose from $2,244 in 2023 to $2,347 in 2024 (+4.6%), outpacing hourly wage growth from $42.49 to $43.47 (+2.3%) and widening the gap between rent and earnings by 2.25 points.
That widening gap in D.C. helps explain why housing costs remain such a pressure point locally: in the broader DMV region, nearly 500,000 low- and moderate-income households earning above the federal poverty line still struggle to afford basic necessities, largely due to rising housing costs and economic instability. What’s more, 44% of ALICE renters in D.C. are severely rent-burdened, spending more than half of their income on rent and utilities.
Where Rent Hikes Are Outpacing Wage Growth in the National Capital Area (2023–2024)
- Prince William County, VA — rent +6.65%, wages +4.00% (+2.65 pts)
- Arlington County, VA — rent +4.76%, wages +3.22% (+1.54 pts)
- Montgomery County, MD — rent +3.74%, wages +2.96% (+0.77 pts)
When we zoom in on counties in the National Capital Area, rent increases are outpacing wage growth most sharply in Prince William County, Virginia, where rents rose 6.65% compared to a 4.00% increase in wages — a 2.65-point gap, the largest in the region.
Arlington County, Virginia, follows closely behind. There, rents climbed 4.76% while wages grew 3.22%, creating a 1.54-point gap between housing costs and earnings. This disparity aligns with broader affordability challenges in Arlington County, where 54% of ALICE renters are severely rent-burdened, spending more than half of their income on housing and utilities.
Montgomery County, Maryland, also saw rent growth outpace wages, though by a narrower margin. Between 2023 and 2024, rents rose 3.74% while wages increased 2.96%, resulting in a 0.77-point gap. Elsewhere in Northern Virginia, the pattern persists but is less pronounced. In Loudoun County and Fairfax County, rent increases exceeded wage growth by 0.35 points and 0.28 points, respectively.
By contrast, Prince George’s County, Maryland, stands out as the exception. There, wages rose 3.82% between 2023 and 2024, outpacing rent growth of 2.10%, making it the only major county in the National Capital Area where earnings surpassed rental costs.
Where Wage Growth is Outpacing Rent Hikes Around the U.S.
Top 10 metros where wages grew faster than rents (2023–2024):
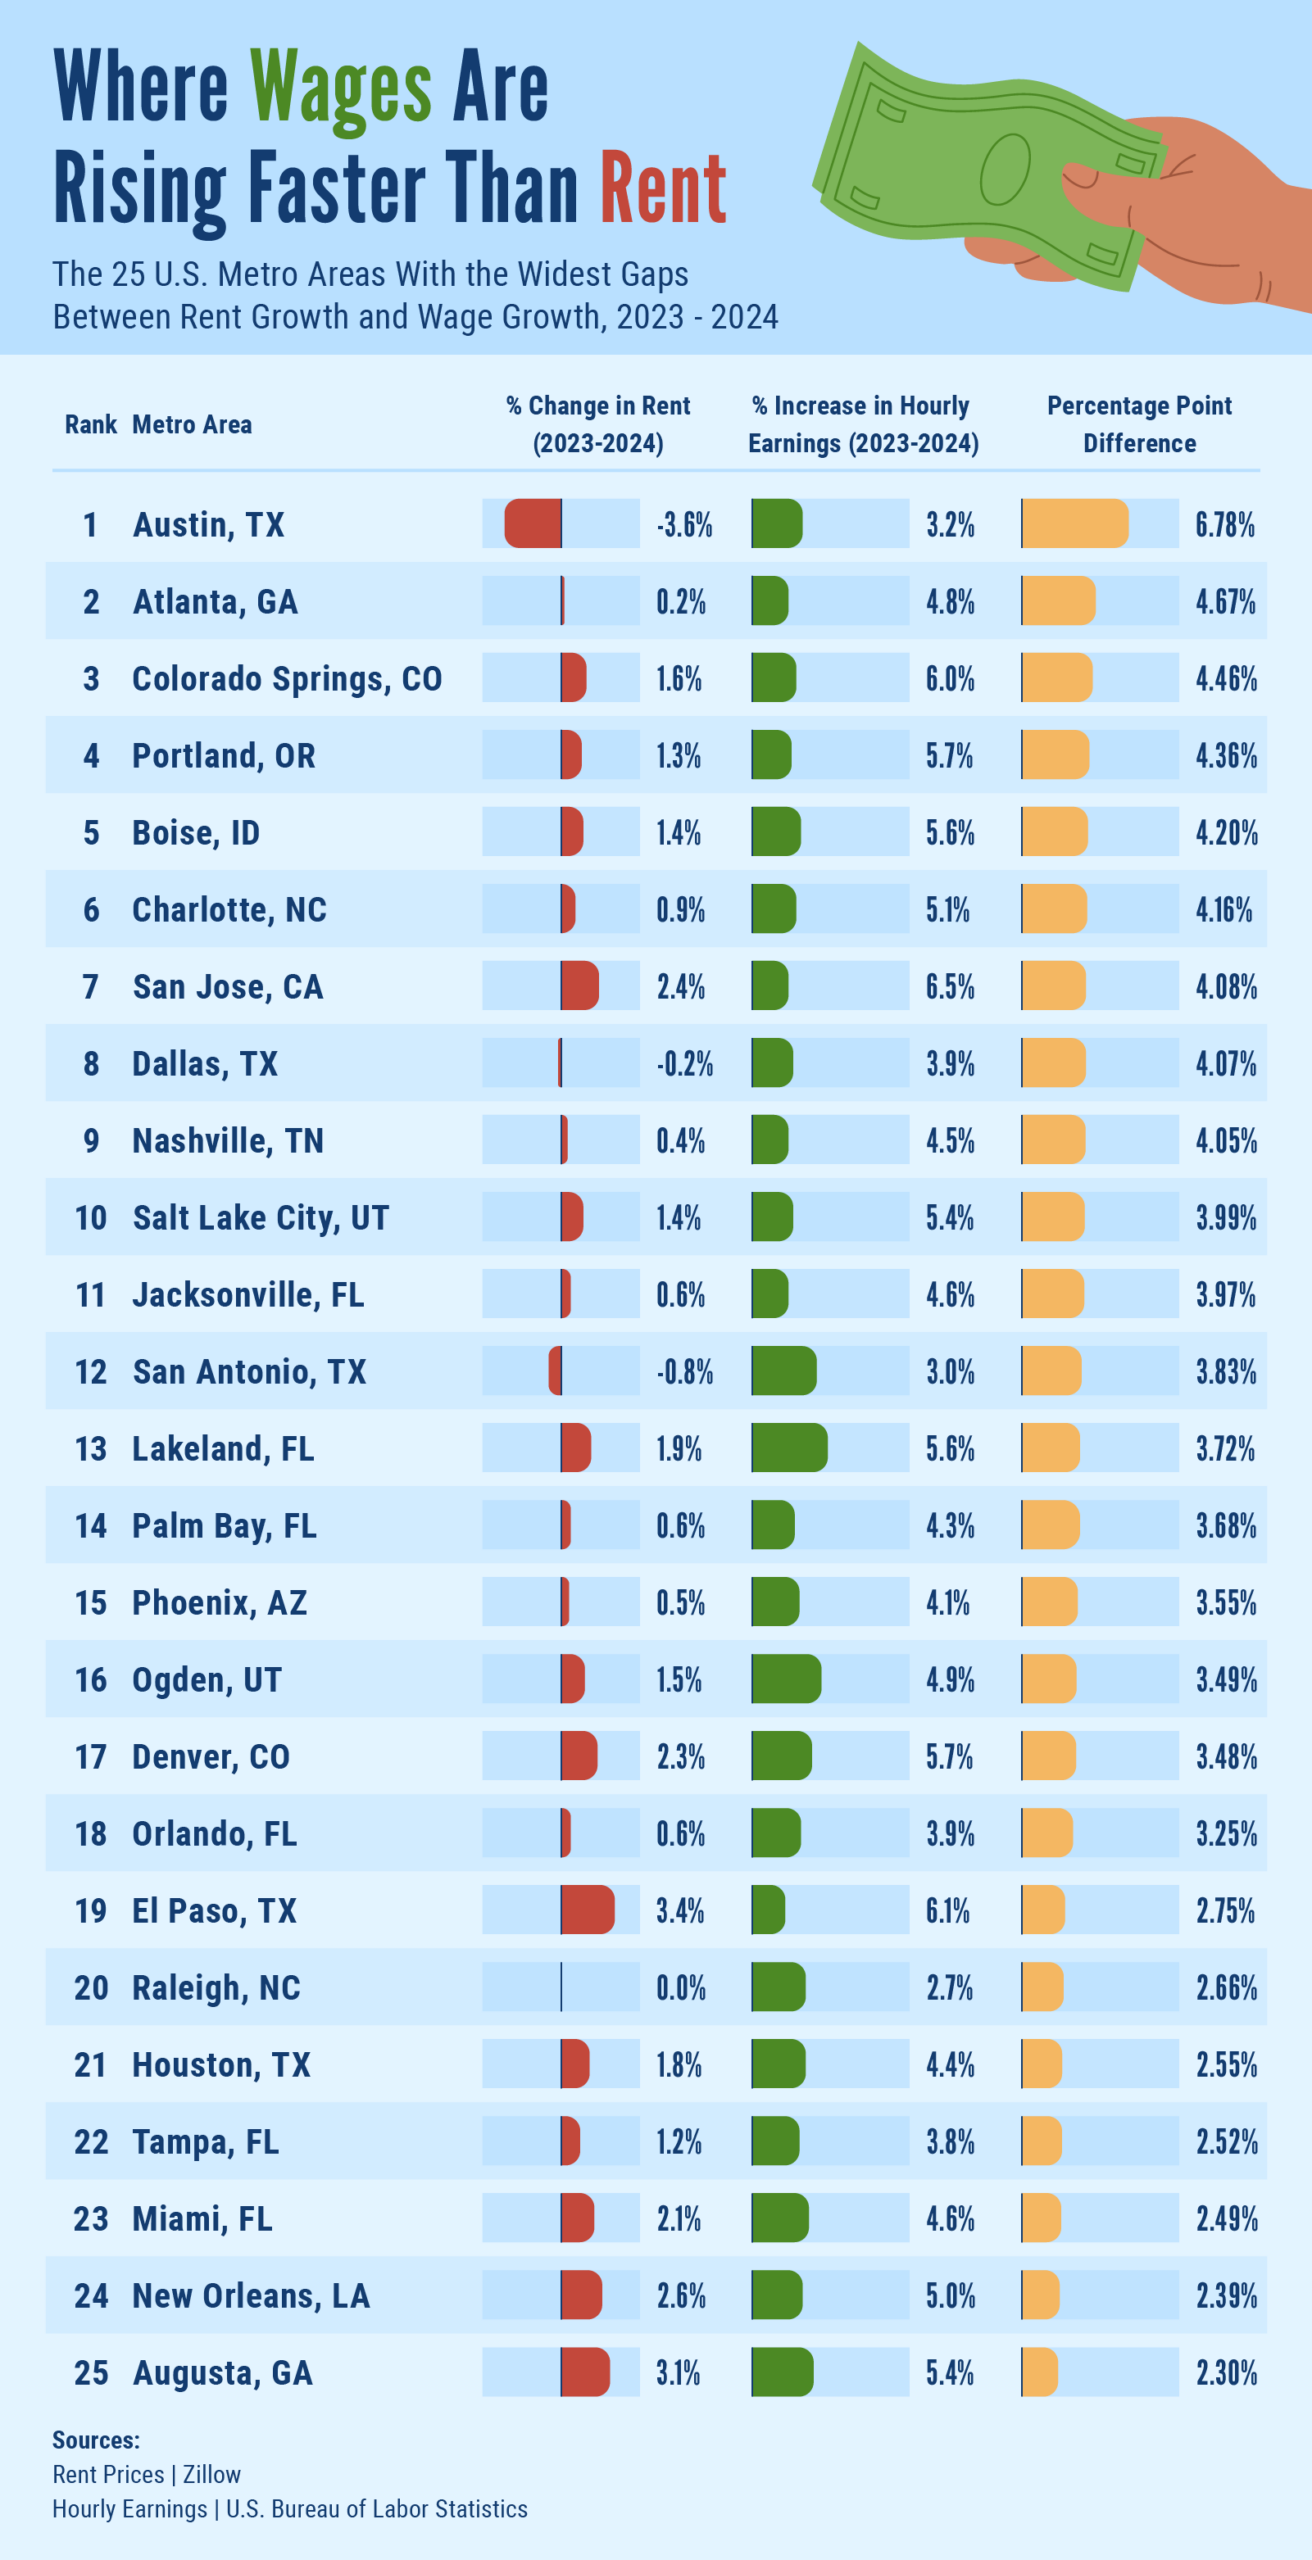
- Austin, Texas — wages +3.22%, rent –3.56% (+6.78 pts)
- Atlanta, Georgia — wages +4.85%, rent +0.18% (+4.67 pts)
- Colorado Springs, Colorado — wages +6.04%, rent +1.58% (+4.46 pts)
- Portland, Oregon — wages +5.69%, rent +1.33% (+4.36 pts)
- Boise, Idaho — wages +5.63%, rent +1.43% (+4.20 pts)
- Charlotte, North Carolina — wages +5.07%, rent +0.91% (+4.16 pts)
- San Jose, California — wages +6.53%, rent +2.45% (+4.08 pts)
- Dallas, Texas — wages +3.89%, rent –0.18% (+4.07 pts)
- Nashville, Tennessee — wages +4.49%, rent +0.44% (+4.05 pts)
- Salt Lake City, Utah — wages +5.40%, rent +1.41% (+3.99 pts)
Austin, Texas, leads the nation with the widest worker-favorable gap, as rents fell 3.56% while wages climbed 3.22%, resulting in a 6.78-point advantage for employees. This marks one of the few large metro areas where the cost of rent actually declined relative to pay.
Several other Texas metros show the same pattern, with Dallas (–0.18%) and San Antonio (–0.80%) recording year-over-year rent declines alongside steady wage growth. In total, five of the top 25 metros where wages are rising faster than rents are located in Texas, highlighting a regional trend where housing markets are cooling while job markets remain strong.
Where Rent is Rising Faster Than Wages Since COVID-19 Around the U.S.
Top 10 metros with the widest 5-year rent–wage growth gaps (2019–2024):
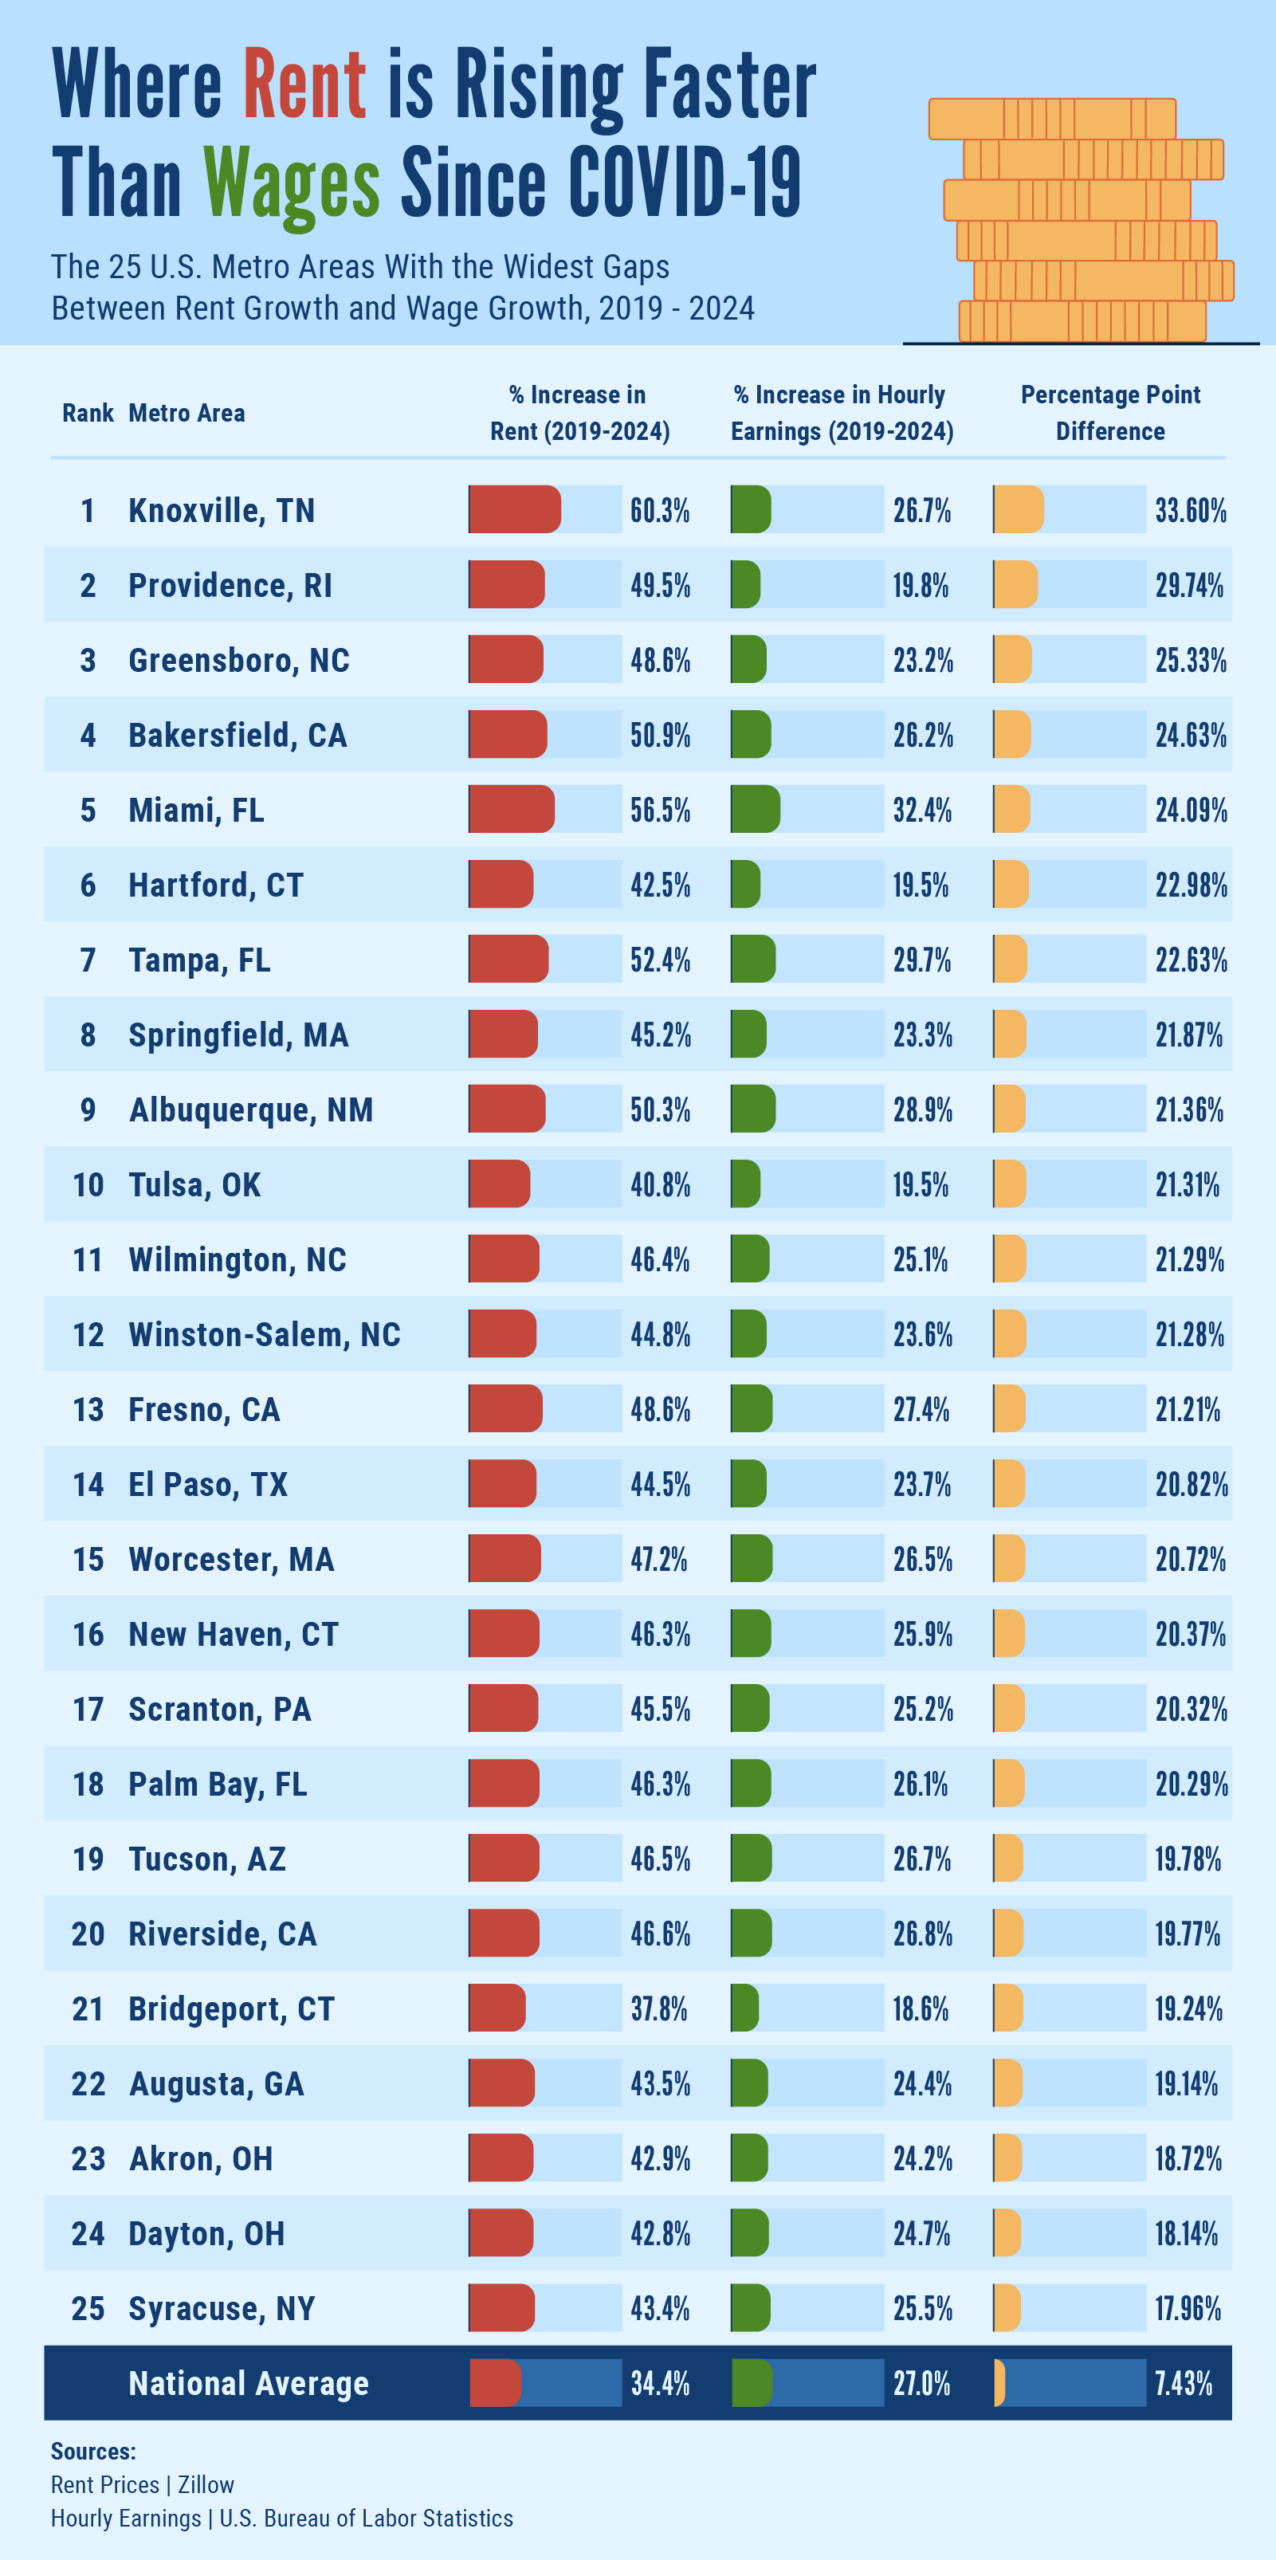
- Knoxville, Tennessee — rent +60.28%, wages +26.68% (+33.60 pts)
- Providence, Rhode Island — rent +49.53%, wages +19.78% (+29.74 pts)
- Greensboro, North Carolina — rent +48.56%, wages +23.24% (+25.33 pts)
- Bakersfield, California — rent +50.86%, wages +26.23% (+24.63 pts)
- Miami, Florida — rent +56.54%, wages +32.45% (+24.09 pts)
- Hartford, Connecticut — rent +42.49%, wages +19.51% (+22.98 pts)
- Tampa, Florida — rent +52.37%, wages +29.74% (+22.63 pts)
- Springfield, Massachusetts — rent +45.22%, wages +23.35% (+21.87 pts)
- Albuquerque, New Mexico — rent +50.29%, wages +28.93% (+21.36 pts)
- Tulsa, Oklahoma — rent +40.81%, wages +19.50% (+21.31 pts)
The average national gap between rent and wage growth over the past five years is 7.43 percentage points, but in top-ranking metros, that gap exceeds 20–30 percentage points. While most metro areas saw wages rise between 20–27% since 2019, rents climbed far more steeply in many of those same metros — often between 40–60% — outstripping income growth for many working households in those areas.
Knoxville, Tennessee, ranks first, with rents surging more than 60% since 2019 while wages rose just 26.7%, leaving a 33.6-point gap, which is the widest in the country. The trend is particularly pronounced across the South, which accounts for 10 of the top 25 metros where rent growth has most outpaced wage gains. California, Connecticut, Florida, and North Carolina each have three metros in the top 25, underscoring that this affordability crisis spans both coasts.
Where Rent is Rising Faster Than Wages Since COVID-19 in the National Capital Area (2019–2024)
- Prince William County, VA — rent +33.54%, wages +27.34% (+6.20 pts)
- Loudoun County, VA — rent +33.67%, wages +29.77% (+3.90 pts)
- Prince George’s County, MD — rent +23.35%, wages +21.81% (+1.44 pts)
Since the onset of the pandemic, Prince William County, Virginia, has experienced the largest gap between rent growth and wage growth in the National Capital Area. Between 2019 and 2024, rents surged 33.54% while wages increased 27.34%, resulting in a 6.20-point gap that highlights mounting affordability pressures over the five-year period.
Loudoun County, Virginia, follows with a notable but smaller divide. Over the same period, rents climbed 33.67% compared to a 29.77% rise in wages, leaving a 3.90-point gap between housing costs and earnings.
In Prince George’s County, Maryland, rent growth has also outpaced wages since COVID-19, though by a narrower margin. From 2019 to 2024, rents increased 23.35% while wages rose 21.81%, creating a 1.44-point gap. This gap reflects ongoing affordability challenges in Prince George’s County, where 45% of ALICE renters are severely rent-burdened.
Full Data
Below are two interactive tables with the complete results for all 100 metro areas analyzed in the study. Each table includes rent levels, wage levels, year-over-year or five-year percentage changes, and the percentage-point difference between rent growth and wage growth. Sort the columns by specific categories!
Closing Thoughts
Across the country, many workers see paychecks grow, yet housing costs still climb faster in a significant share of metro areas. The one-year view shows concentrated pressure in the Northeast, while the five-year trend reveals double-digit rent increases outpacing wage gains in dozens of markets. Even in Washington, D.C., the year-over-year gap underscores how fragile progress can be for households trying to keep up.
This study aligns with United Way NCA’s mission to advance economic equity by spotlighting where working individuals, especially ALICE (Asset Limited, Income Constrained, Employed) households, remain at risk of falling behind despite wage growth. By making these disparities visible, United Way NCA seeks to drive solutions that close the gap: expanding access to quality jobs, improving financial resilience, and supporting affordable housing.
For locals seeking immediate support, individuals can also find help through United Way NCA’s rental assistance guide and collection of community resources, which connect residents across the DMV to services ranging from food support and health care to housing assistance.
To learn more about the realities facing ALICE households, visit our ALICE page or explore Economic Opportunity initiatives. You can also donate or volunteer to help ensure every individual and family in our region has the chance to thrive.
Methodology
We began with a list of the 100 largest metro areas in the U.S. and wanted to determine where rent increases are outpacing wage growth. For rental data, we used Zillow’s Observed Rent Index (ZORI) to find the average rents in each metro area. For wage data, we used the U.S. Bureau of Labor Statistics to pull the average hourly earnings in each metro.
We calculated the percentage change in both rent prices and hourly wages year over year (2023 to 2024) as well as over the five years from 2019 to 2024. By comparing the percent change in rents to the percent change in wages, we identified the percentage point difference between the two. This allowed us to pinpoint the metro areas where rent growth has most significantly outpaced wage growth—both over the past year and before the start of the COVID-19 pandemic. We also highlighted the opposite trend: metro areas where wages have grown faster than rents from 2023 to 2024.
Fair Use
You are welcome to use, reference, and share non-commercial excerpts of this study with proper attribution. If you cite or cover our findings, please link back to this page so readers can view the full methodology, charts, and context.