


Economic Opportunity
Vacant Homes vs. Homelessness in Cities Across the U.S.
Sep 14, 2026

Key Findings
- U.S. homelessness reached a record high in 2024, with 771,480 people experiencing homelessness, up from 653,100 in 2023.
- There are currently more than 14 million vacant housing units in the U.S., amounting to about 18 vacant homes for every one person experiencing homelessness.
- Houston, Texas, has the highest ratio of vacant homes to unhoused people, with 66.68 vacant homes per person experiencing homelessness.
- In the National Capital Area, Arlington, Virginia, ranks eighth overall, with 46.57 vacant homes for every person experiencing homelessness, the highest among local cities analyzed.
- Washington, D.C. ranks sixth among cities with the largest unhoused populations, with 799.72 people experiencing homelessness per 100,000 residents. It also ranks sixth for unhoused children under 18, with 148.67 per 100,000 residents.
U.S. Cities With the Highest Ratio of Unhoused People to Vacant Homes
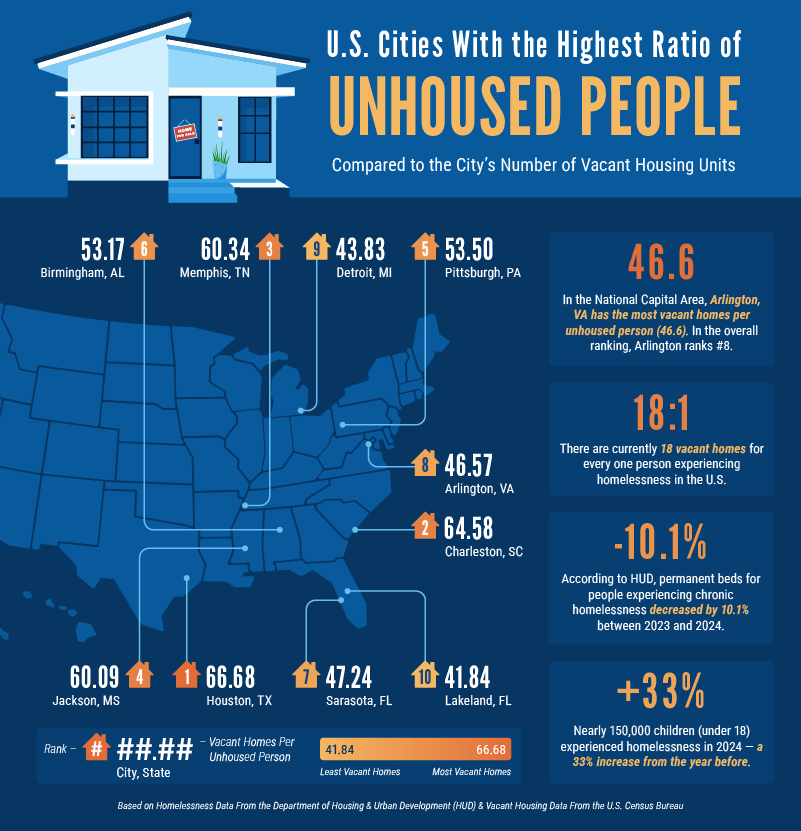
Across the U.S., there are currently about 18 vacant homes for every one person experiencing homelessness nationwide. The contrast points to a growing imbalance in communities where housing exists, but too many residents still cannot access a safe and stable place to live.
In this year’s analysis, Houston, Texas, has the highest ratio of vacant homes to people experiencing homelessness, with 66.68 vacant homes for every unhoused person. Charleston, South Carolina, follows closely with 64.58 vacant homes per unhoused person, while Memphis, Tennessee, ranks third at 60.34. Jackson, Mississippi, and Pittsburgh, Pennsylvania, round out the top five, with more than 53 vacant homes per unhoused person in each city.
The National Capital Area also appears in the top 10. Arlington, Virginia, ranks eighth overall, with 46.57 vacant homes for every person experiencing homelessness. That is the highest ratio among the National Capital Area cities included in the study, ahead of Silver Spring, Maryland; Alexandria, Virginia; and Washington, D.C. While each local market faces different housing pressures, Arlington’s ranking illustrates that the presence of vacant housing does not necessarily translate into accessible housing for residents facing financial hardship.
United Way NCA’s ALICE data underscores that affordability challenge. In 2024, the ALICE Household Survival Budget in the D.C. Metro Area was $48,192 for a single adult and $116,076 for a family of four—far above the Federal Poverty Level of $15,060 for a single adult and $31,200 for a family of four.
These findings come at a time when homelessness is rising sharply across the country. HUD data shows that permanent beds for people experiencing chronic homelessness decreased by 10.1% between 2023 and 2024. During that same period, nearly 150,000 children under 18 experienced homelessness, a 33% increase from the year before. For families already struggling to afford basic needs, the loss of stable housing can quickly deepen financial hardship, disrupt education, and make it harder to access health care, employment, and other essential support.
U.S. Cities With the Highest Populations of Unhoused People
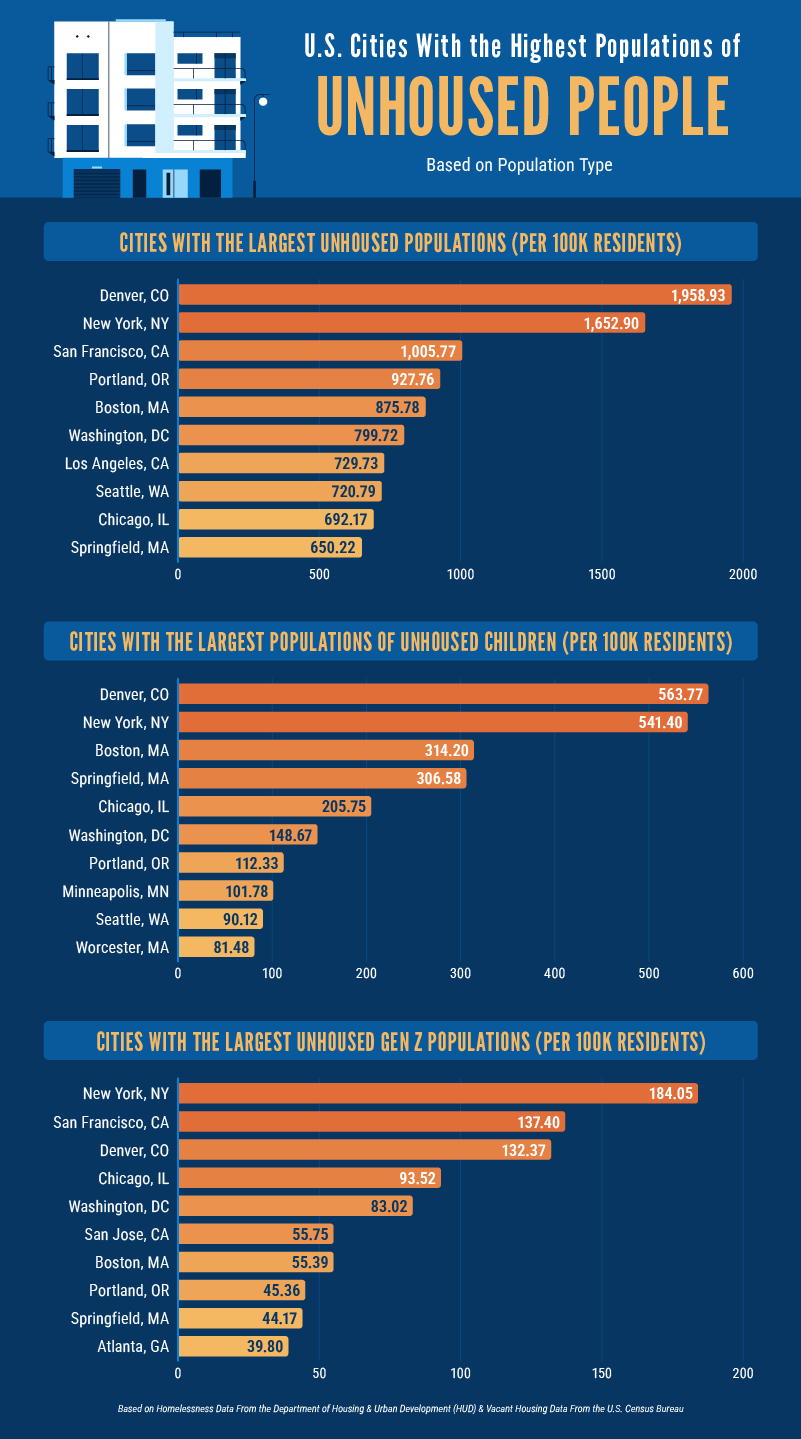
Beyond the ratio of vacant homes to people experiencing homelessness, the data also shows where homelessness is affecting the largest share of residents. Denver ranks first among the cities analyzed, with 1,958.93 people experiencing homelessness per 100,000 residents. New York City follows with 1,652.90, while San Francisco, Portland and Boston round out the top five. Washington, D.C. also ranks high on the list, placing sixth overall with 799.72 people experiencing homelessness per 100,000 residents.
The data is especially concerning for children and young adults. Denver and New York City have the highest rates of unhoused children under 18, with more than 540 children experiencing homelessness per 100,000 residents in each city. Washington, D.C. ranks sixth in this category with 148.67 unhoused children per 100,000 residents. For young adults ages 18 to 24, New York City has the highest rate, followed by San Francisco, Denver, Chicago and Washington, D.C.
ALICE data shows that many families are already financially stretched before they lose housing. In the D.C. Metro Area, 64% of single-female-headed families with children and 51% of single-male-headed families with children were below the ALICE threshold in 2024, compared with 16% of married-parent families with children.
When children experience homelessness, they experience disruptions in school, a lack of health care, and a sense of routine that helps families stay grounded. When young adults experience homelessness, it can make it harder to continue education, find stable employment, or build a path toward long-term financial security.
In communities like those in the National Capital Area, where homelessness affects residents across age groups, the data highlight the importance of coordinated efforts among housing providers, public agencies, nonprofits, and community organizations to address the many factors contributing to housing instability.
Year-Over-Year Population Changes of Unhoused People
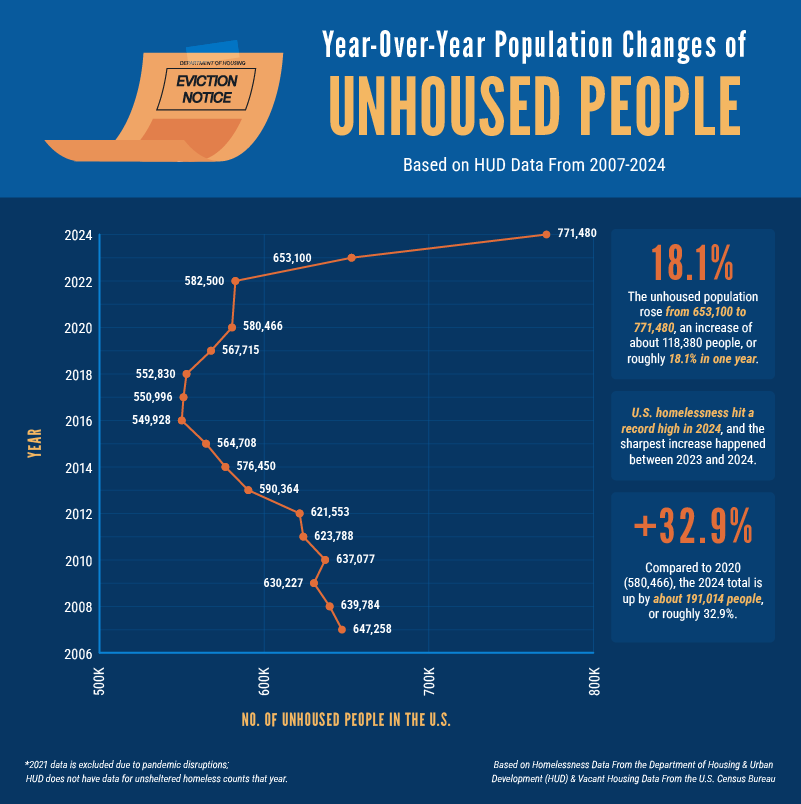
Homelessness in the U.S. reached a record high in 2024, with 771,480 people experiencing homelessness nationwide. That marks a sharp increase from 653,100 people in 2023, adding more than 118,000 people to the national unhoused population in just one year.
This recent spike is part of a longer upward trend. Compared with 2020, when 580,466 people were experiencing homelessness, the 2024 total is up by nearly 191,000 people, or roughly 32.9%. While the causes of homelessness vary across communities, the year-over-year growth points to mounting pressure on households already navigating high housing costs, limited savings and gaps in access to stable support systems.
The increase is especially alarming for children and families. Nearly 150,000 children under 18 experienced homelessness in 2024, a 33% increase from the year before. At the same time, HUD data shows that permanent beds for people experiencing chronic homelessness decreased by 10.1% between 2023 and 2024. Together, these trends show that more people are facing housing instability while key supports are becoming harder to access.
Closing Thoughts
The relationship between vacant homes and homelessness is not simple, but the data makes one thing clear: housing instability remains a growing crisis in communities across the country. In 2024, homelessness reached a record high, with more than 771,000 people experiencing homelessness in the U.S. At the same time, millions of housing units remain vacant, underscoring the gap between available housing and accessible, stable housing.
For families and individuals in the National Capital Area, that gap can be especially difficult to navigate. Housing instability does not happen in isolation. It is often tied to employment, education, health, food access, and financial stability, all of which can affect whether a household is able to stay safely housed. This is especially true for ALICE households, who earn above the Federal Poverty Level but still cannot afford essentials such as housing, child care, food, transportation, health care, and technology. In the National Capital Area, 718,709 households—32.5%—were below the ALICE threshold in 2024.
United Way NCA conducted this study to better understand how housing instability and housing availability intersect across the country and throughout the National Capital Area. By examining these trends, we hope to contribute to broader conversations around housing affordability, financial stability and the systemic challenges that leave many households vulnerable to housing insecurity.
United Way NCA works to strengthen the National Capital Area by advancing upstream economic opportunity, supporting long-term financial stability for ALICE households, and collaborating with regional community partners including those who specialize in direct housing pathways. Research like this helps inform conversations about the challenges many households face and the importance of addressing the underlying economic factors that contribute to housing instability before it leads to homelessness.
Methodology
To determine the number of vacant homes per unhoused person in America’s largest metros, we pulled the most updated number of people experiencing homelessness in each city (or continuum of care) from the Department of Housing and Urban Development (HUD). We also pulled the number of vacant housing units in each city from the U.S. Census Bureau’s most recent American Community Survey data. We then divided the number of vacant units by the number of unhoused people in each city to find the number of vacant homes per unhoused person.
We found all homelessness statistics by race, age, year, and geography using data from HUD’s Annual Homelessness Assessment Reports (AHAR).
Fair Use
You are welcome to use, reference, and share non-commercial excerpts of this study with proper attribution. If you cite or cover our findings, please link back to this page so readers can view the full methodology, charts, and context.