Throughout America, disparities exist between different groups of people when it comes to things like housing, quality of life and much more. A major cause for many of these socioeconomic differences is disparities in how these groups are paid for their labor—disparities that have their own long-standing societal causes.
These inequalities in pay have been around for decades, with differences in pay between men and women and how much Black, Indeginous and People of Color (BIPOC) citizens earn compared to white people becoming part of a broader conversation about inequality and inequity in America more recently. Despite the increased focus on these wage gaps and legislation aimed at reducing these disparities, they still exist today.
To illustrate how extensive these disparities are and to show how they impact people all around the country, the team at United Way of the National Capital Area took a closer look at how gender and race impact earnings in the U.S. We used publicly available data from the 2019 U.S. Census to find the median annual salary for men, women, white people, BIPOC and the overall population. We collected the data for each of those populations for all 50 states (and the District of Columbia), as well as 76 major metropolitan areas across the country. We then calculated the pay disparities between different groups and mapped out the results.
Read on to see the full findings.
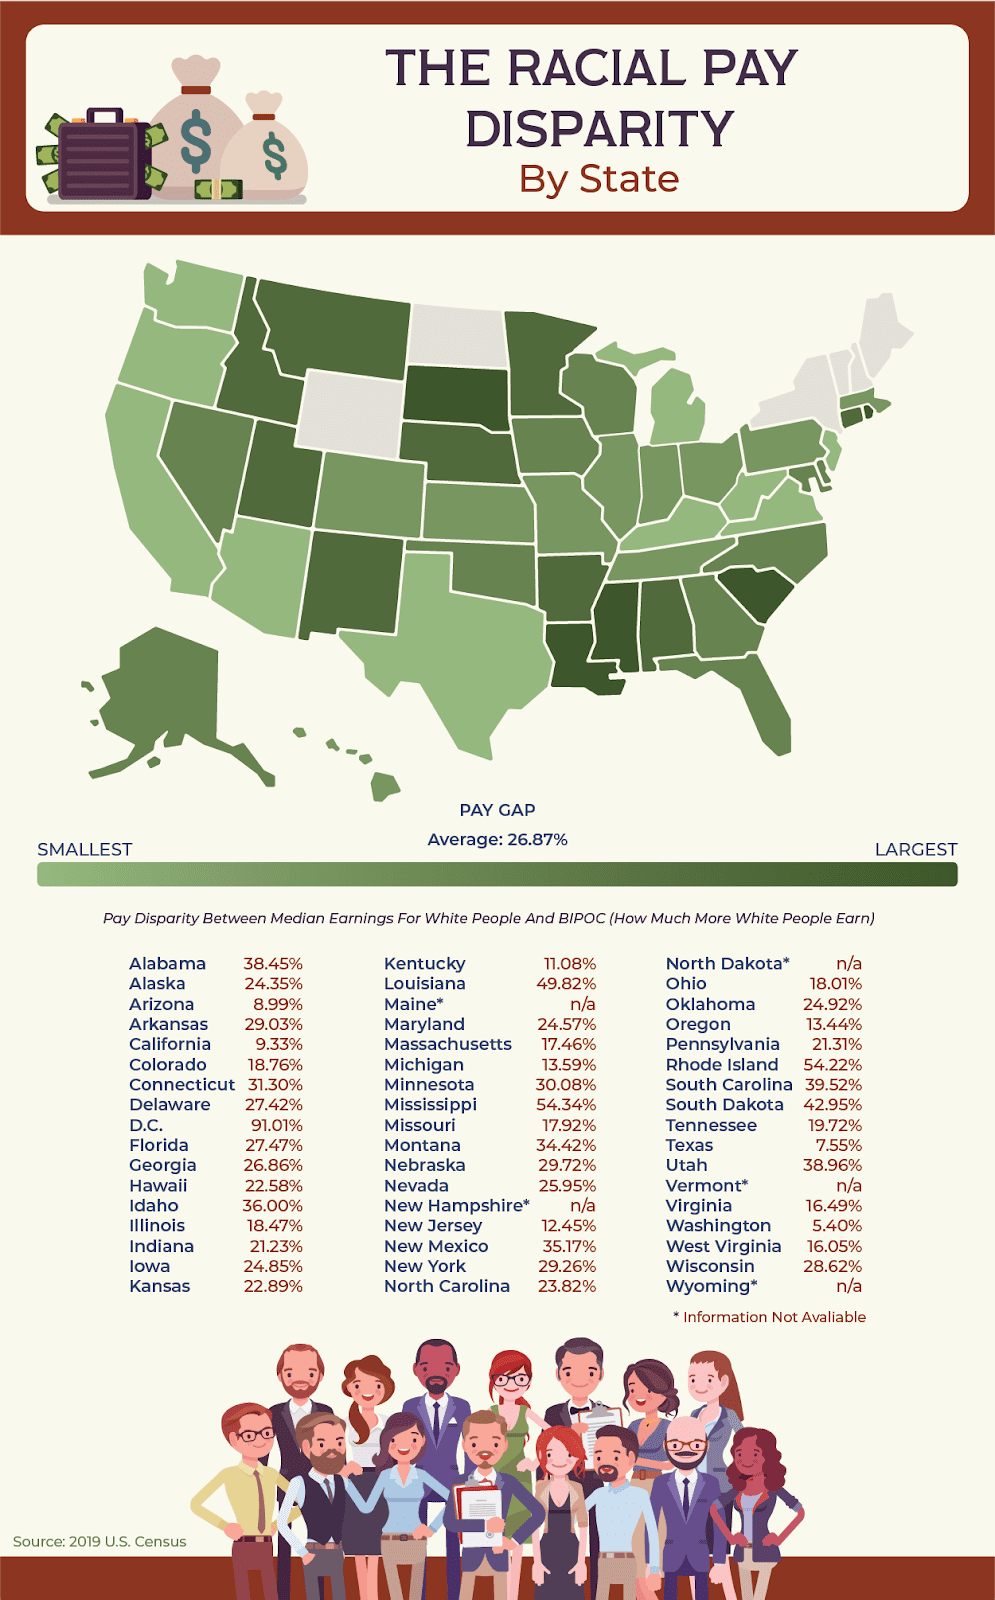
The first disparity we wanted to look at was the racial pay gap between white people and BIPOC in every state. We found salaries to be most equitable in western states, with Washington leading the way; white people only earn 5.4% more than BIPOC in the Evergreen State. The only other states with a gap of less than 10% are Texas, Arizona and California—all located in the western part of the country. Conversely, the District of Columbia has the least equitable pay across races according to the Census, as white people make a staggering 91% more money than BIPOC in the nation’s capital—a number nearly four times higher than the national average of 26.87%. That is well above the second-largest gap of 54.34% in Mississippi.
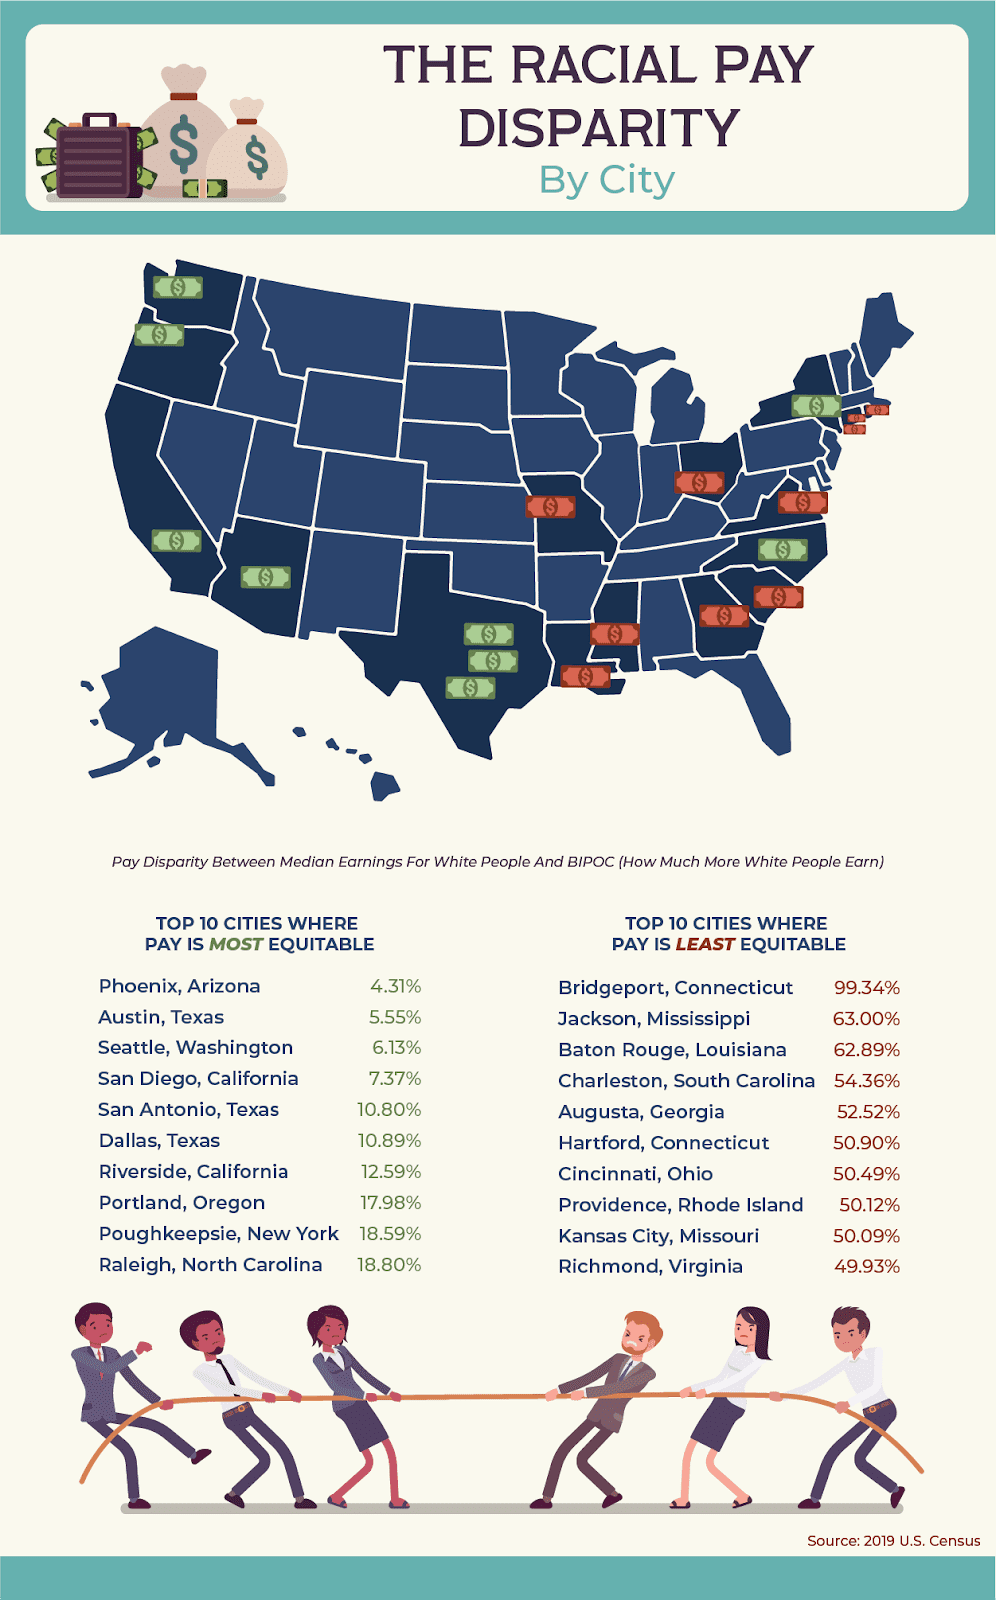
When looking at the same data on a city level, we were not surprised to see cities in states with small overall disparities do well. The top seven cities with the smallest racial pay gaps all come from Arizona, Texas and California, states with overall pay gaps of less than 10%. Phoenix, Arizona, leads the way in this category as the only city with a pay difference of less than 5%.
In terms of cities with the largest racial pay gaps, Bridgeport, Connecticut, performed the worst of the over 75 metro areas we evaluated. On average, white people in Bridgeport make nearly double what BIPOC make there. The rest of the top five are all Southern cities—Jackson, Mississippi, Baton Rouge, Louisiana, Charleston, South Carolina, and Augusta, Georgia, all feature racial pay disparities between 52% to 63%.
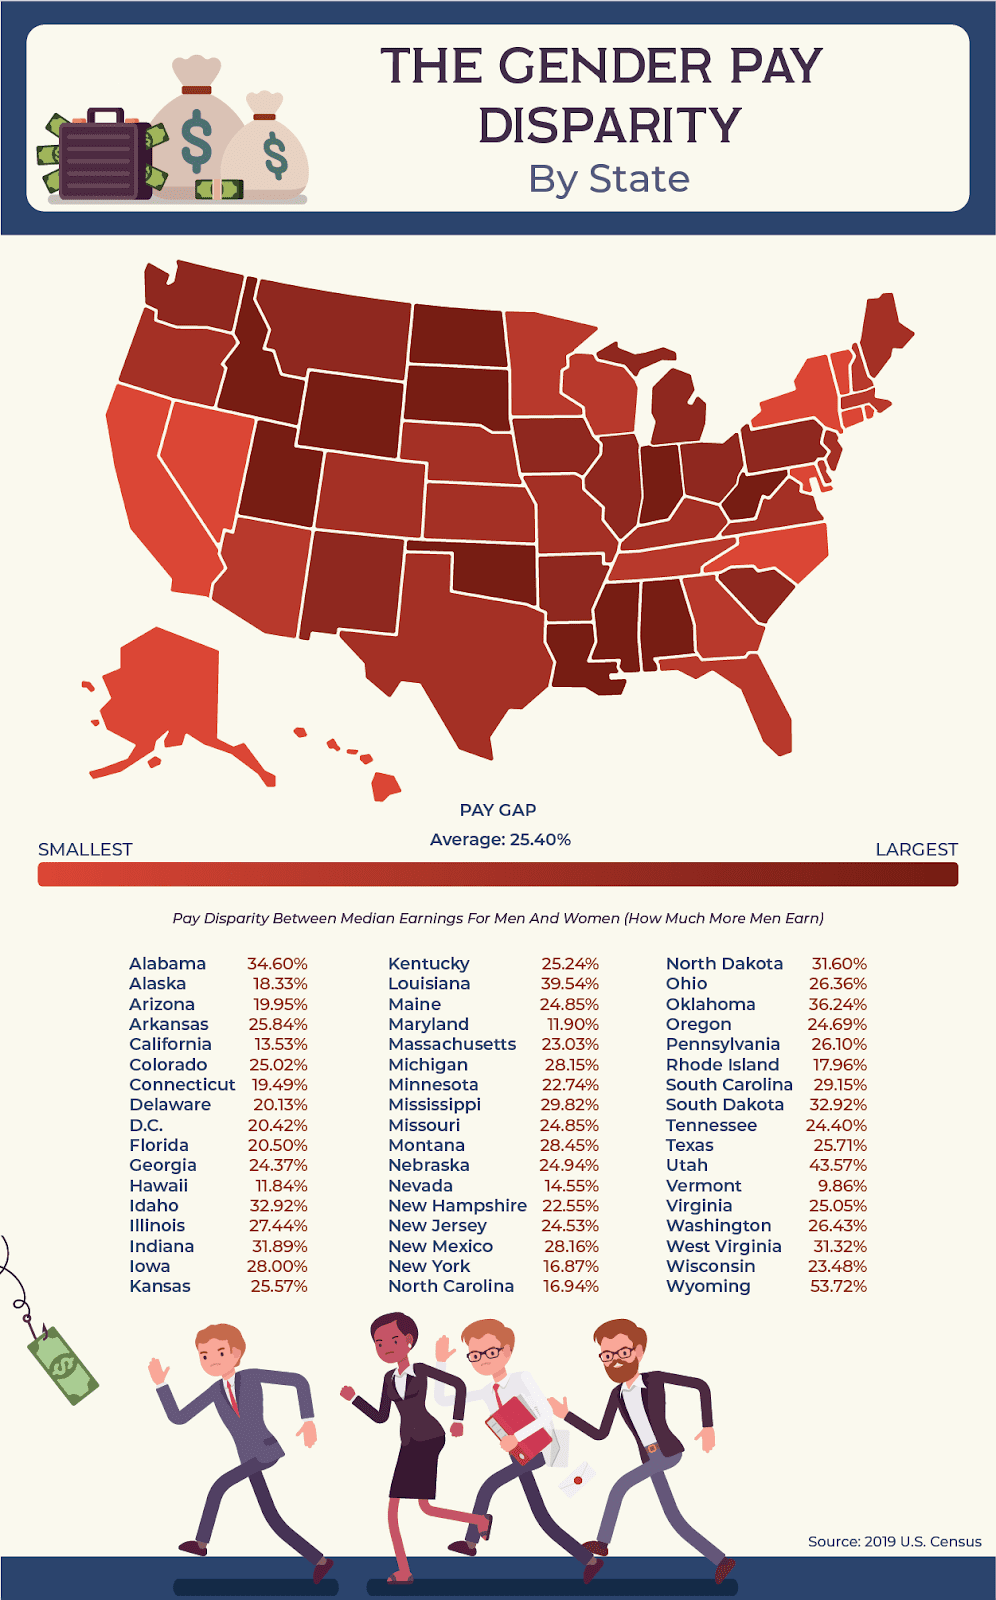
When it comes to pay discrepancies between men and women, we also see significant and notable differences in compensation across the country. While the smallest racial pay gap was 5.4%, the smallest gender pay gap is nearly double that, at 9.86%, in Vermont. However, the opposite end of the spectrum is significantly less extreme than the largest end of the racial pay gap. Only two states—Utah and Wyoming—have pay disparities along gender lines that exceed 40%, while five states exceed that threshold when evaluating the data along racial lines.
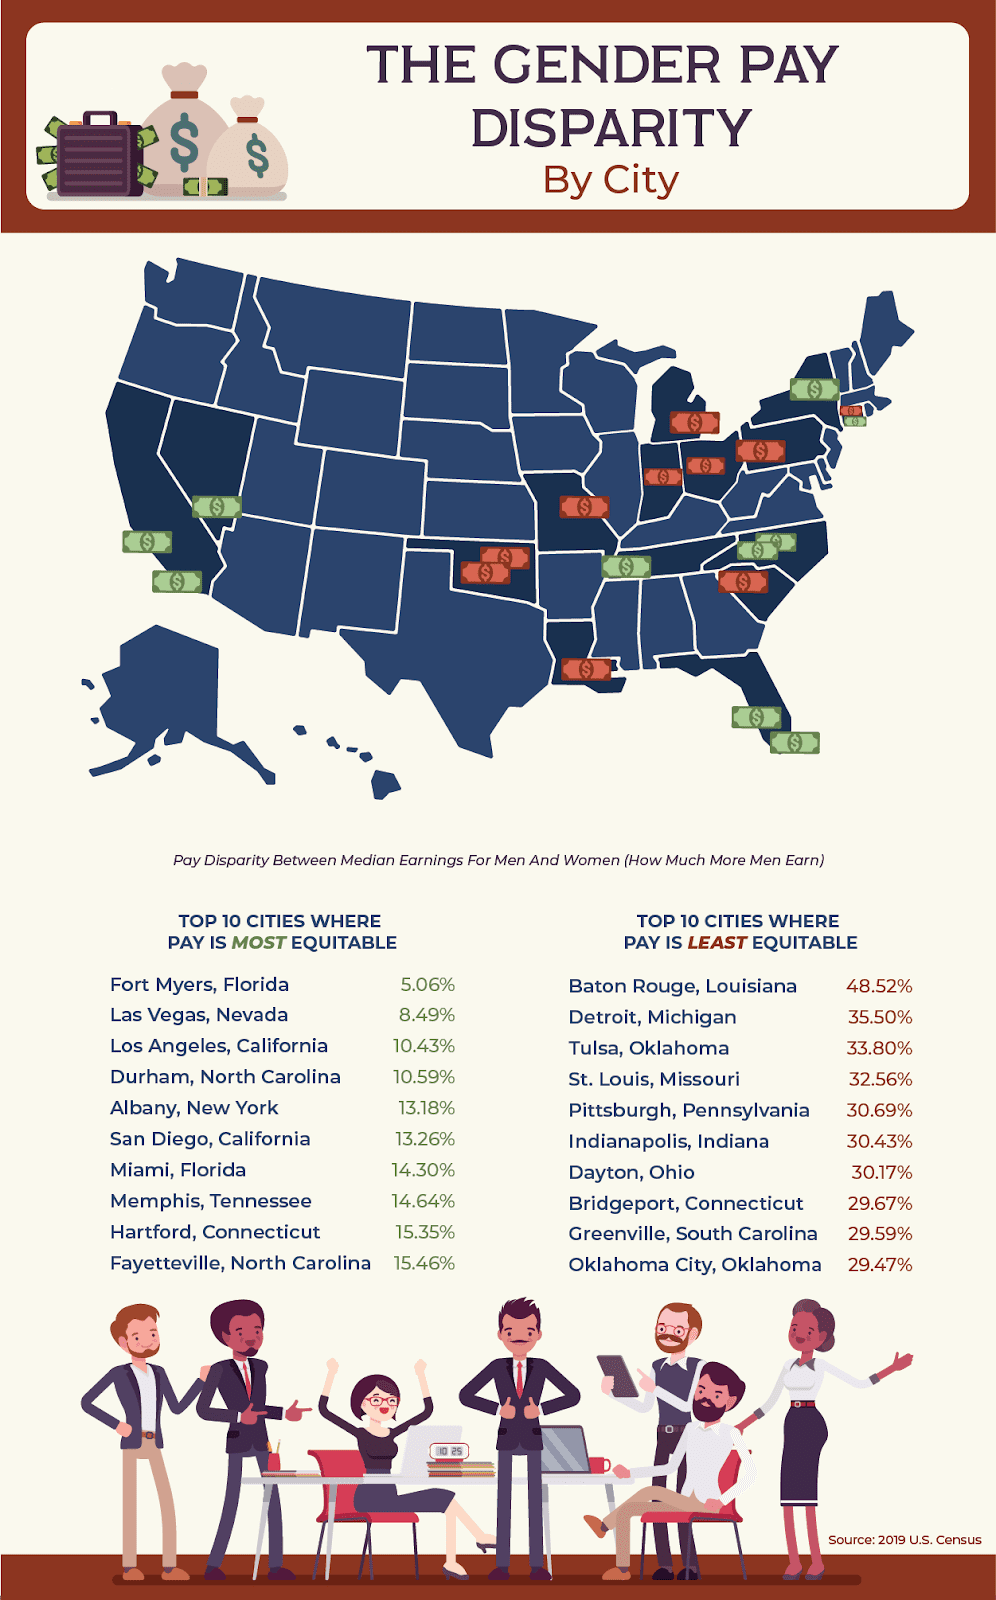
Of the 76 major cities we evaluated, Fort Myers, Florida, is the best city in terms of gender-equitable pay, with a difference just over 5%. Las Vegas, Nevada, is the only other major city with a rate below 10%. Baton Rouge is again one of the least equitable cities in our analysis, with a gender pay gap of nearly 50%—over 10% higher than the next highest wage gap of 35.5% in Detroit, Michigan.
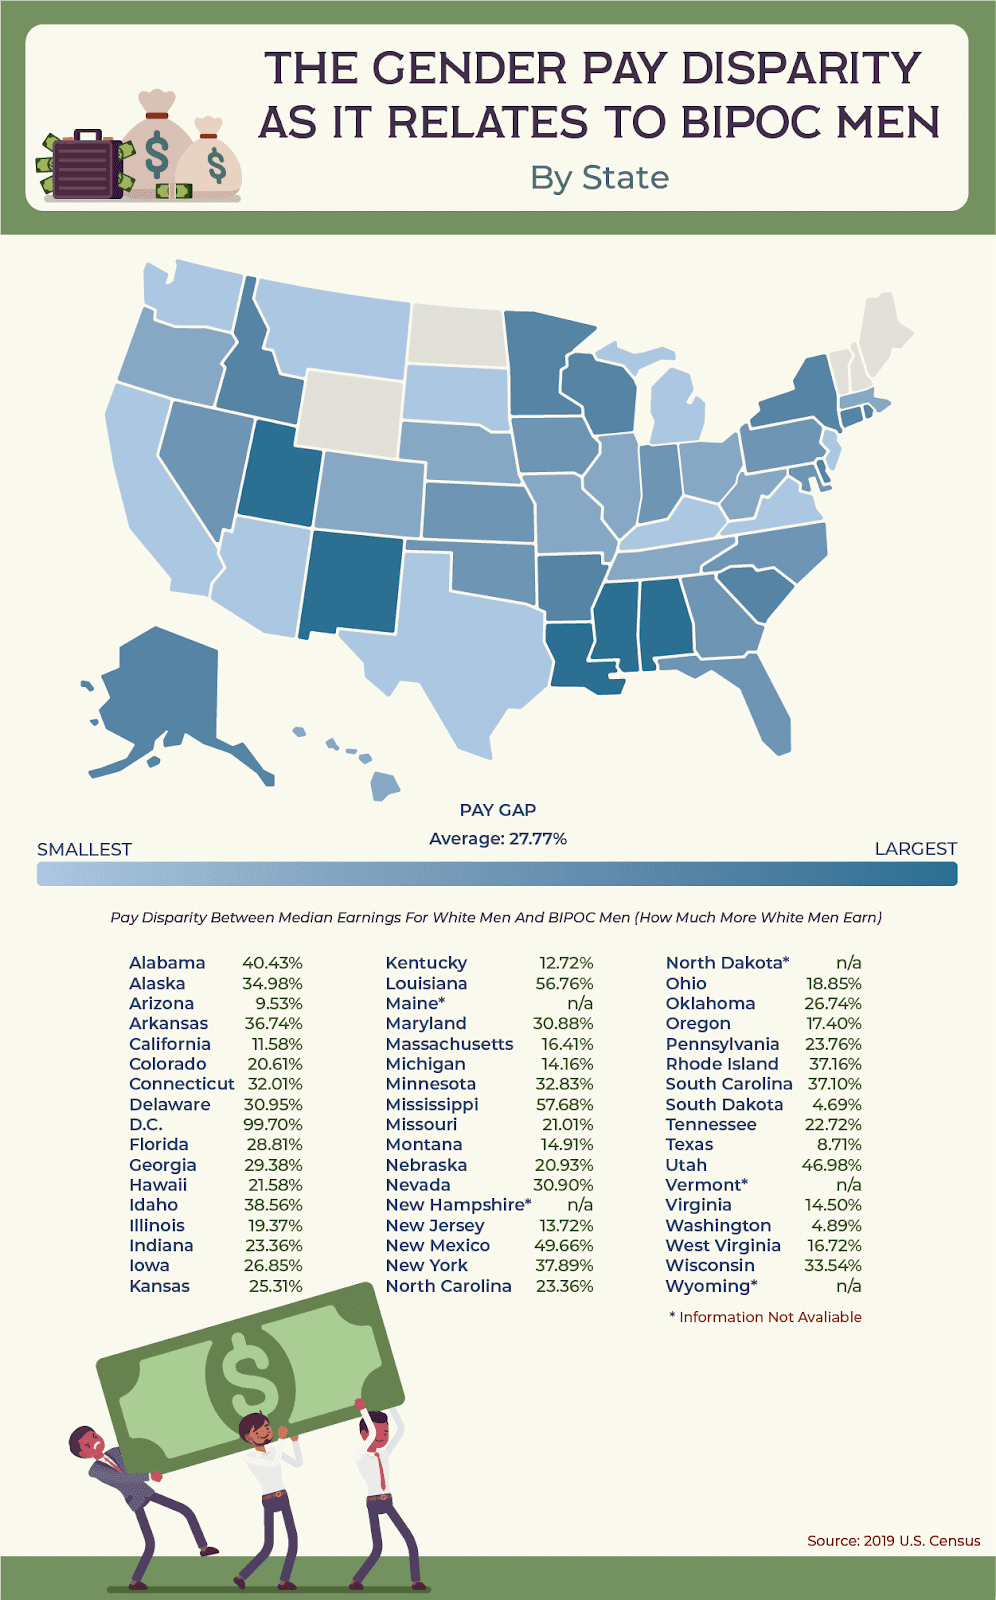
As a final step in this exercise, our team wanted to see how pay compares when combining race and gender. To do this, we found the median salary for white and BIPOC men and compared them to one another by city and state, then did the same for white and BIPOC women.
The results for comparing white men with BIPOC men on a state level are very similar to the overall racial pay gap results, with states like Washington and Texas once again showing some of the smallest gaps in the nation (although there is a new state at the top of the list, as South Dakota’s 4.69% gap is the smallest in the nation by this metric). Similarly, Washington, DC again has a racial pay gap that is far and away the largest in the country when comparing pay for white and BIPOC men, over 40% higher than Mississippi in second.
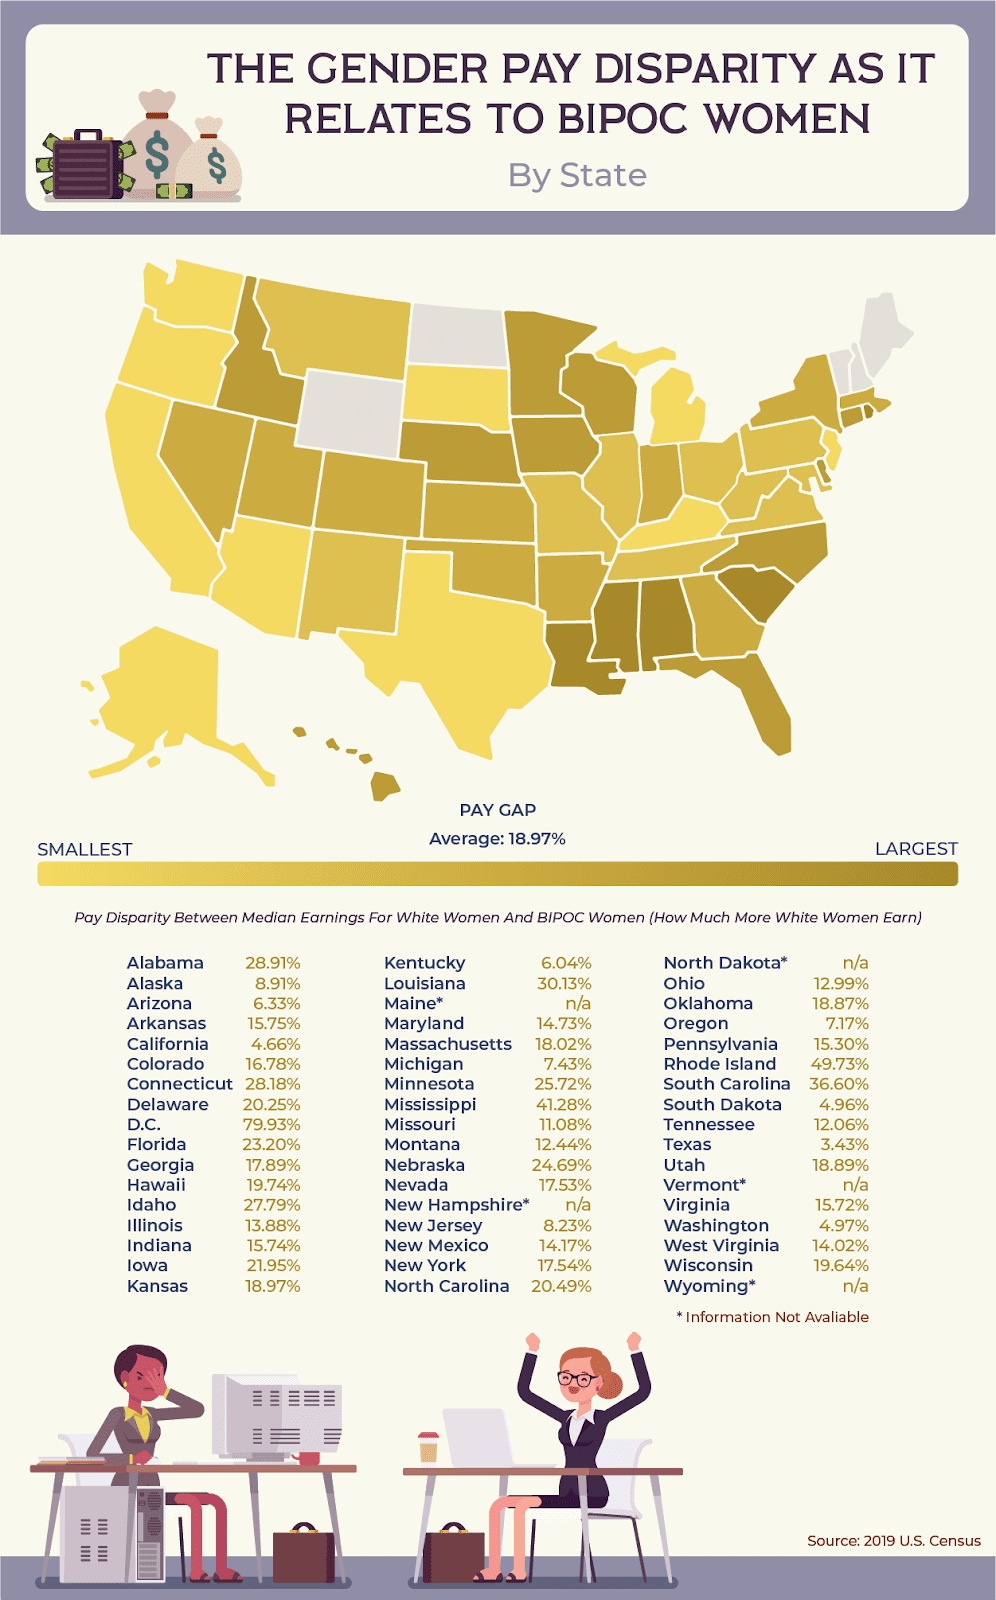
When comparing white and BIPOC women, results mirror those of the male analysis, but with some significant differences. The most notable of these differences is that while DC is still the state with the worst pay gap across racial lines for women, it is almost 20% smaller than the same gap for men, coming in at 79.9% compared to 99% for men.
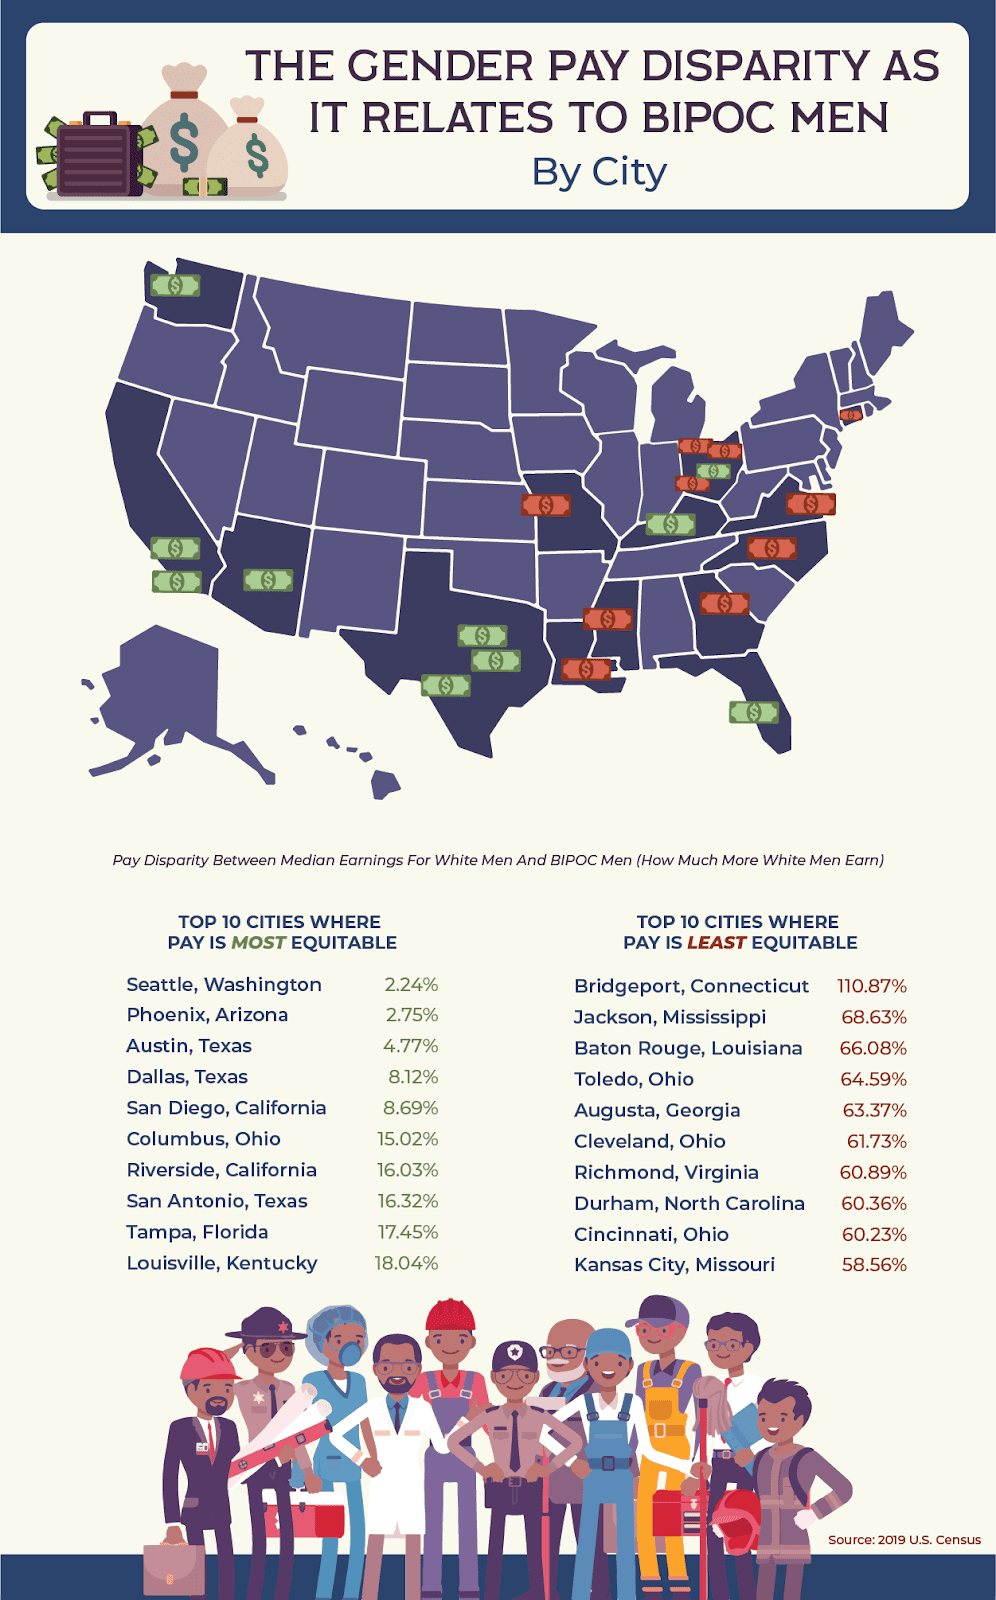
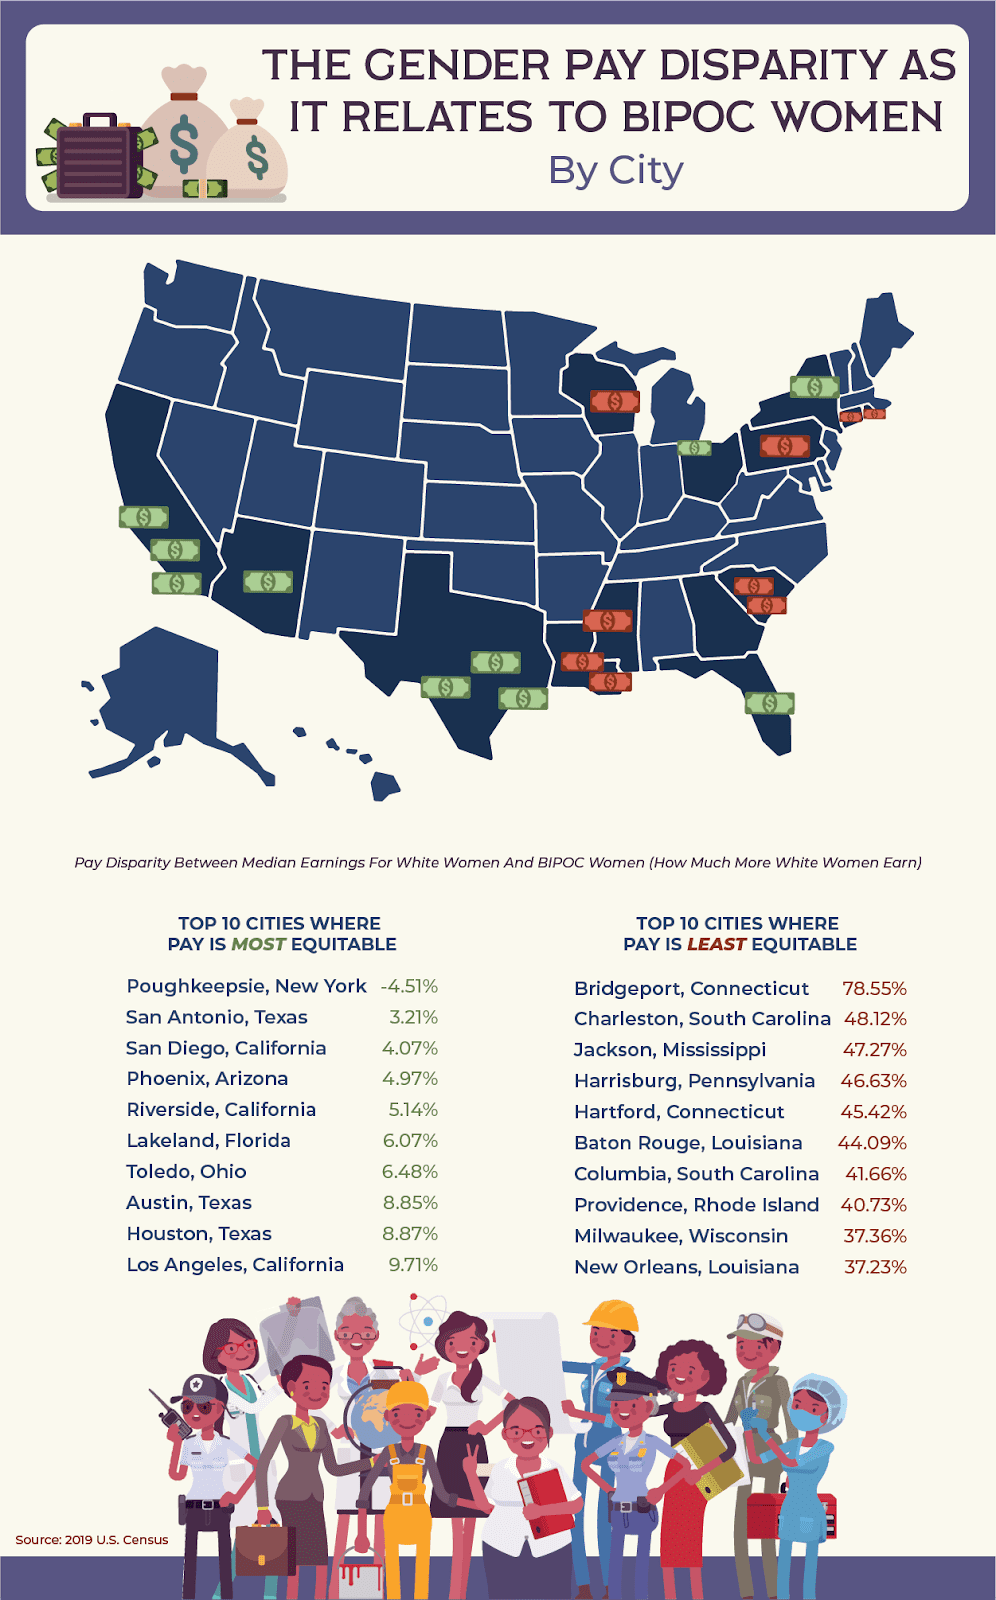
When evaluating cities across both race and gender lines, many results mirror the general racial gap discussed earlier in this piece, but our research revealed one key difference: BIPOC women in Poughkeepsie, New York, actually earn more than white women in the city, bringing home over 4.5% more annually! This is the only city or state in our evaluation where a BIPOC group earns more than whites.
While our analysis shows full results for each state, we only highlighted the top 10 and bottom 10 cities across each metric. We created the interactive database above to showcase the full data for each of the 76 metropolitan areas that were a part of this study.
While far from exhaustive, we hope that this examination of pay disparities in the United States has opened your eyes to the inequalities that still exist in this country, as well as revealing the places that are closest to eliminating those inequalities. Here at United Way of the National Capital Area we will continue to work toward a more just and equitable world for all, and we encourage others to join us in those efforts!