The racial homeownership gap is worse today than it was in 1960 when housing discrimination based on race was legal–a sobering insight, given that 50-plus years have passed since housing discrimination was outlawed. Although homeownership across the country has increased in recent years, the ownership rates for non-white Americans remain low.
Further, reports show that COVID-induced layoffs and furloughs in 2020 were far more likely to cause housing challenges among Black and Latino/a/x workers than among white workers, which exacerbates BIPOC’s inability to purchase homes in 2021, widening the racial homeownership gap as a whole. Still, some states are seeing improved rates in BIPOC homeownership, in part due to policies and programs designed to create a more equitable housing market.
United Way of the National Capital Area is committed to fair economic opportunities for every person in our community, regardless of race, gender, income, ability or zip code. Creating stronger opportunities for BIPOC to purchase affordable homes is included in this mission; therefore, United Way NCA ranked all 50 states against criteria such as median household income, unemployment rate, homeownership rate and the number of U.S. Department of Housing and Urban Development (HUD) loans filed to determine the best (and worst) U.S. states for BIPOC homeownership.
Methodology
We considered six different factors to determine which states are best and worst for BIPOC that are house hunting. Each of the six ranking factors was graded on a five-point scale, with a score of five representing the most favorable conditions. We determined each state’s score from the total of its individual factor scores, which were weighted according to their impact on homeownership opportunities for BIPOC. The sum of these weights is 10, which creates a total possible city score of 50.
The six ranking factors are listed below with their respective weights and source data:
- 1) Median Household Income – Average of Black & Latino/a/x
Weight: 1.10
Source: U.S. Census
2) Unemployment Rate – Average of Black & Latino/a/x
Weight: 0.90
Source: U.S. Bureau of Labor Statistics
3) Total Homeownership Rate – All Races
Weight: 1.25
Source: U.S. Census
4) Number of First-Time Homebuyer Grants and Loan Programs
Weight: 0.75
Source: FHA.com
5) Number of HUD Loans (FHA Purchases)
Weight: 0.50
Source: U.S. Department of Housing & Urban Development (HUD)
6) Number of HUD Loans (FHA Refinances)
Weight: 0.50
Source: U.S. Department of Housing & Urban Development (HUD)
The Top 10 U.S. States for BIPOC Homeownership
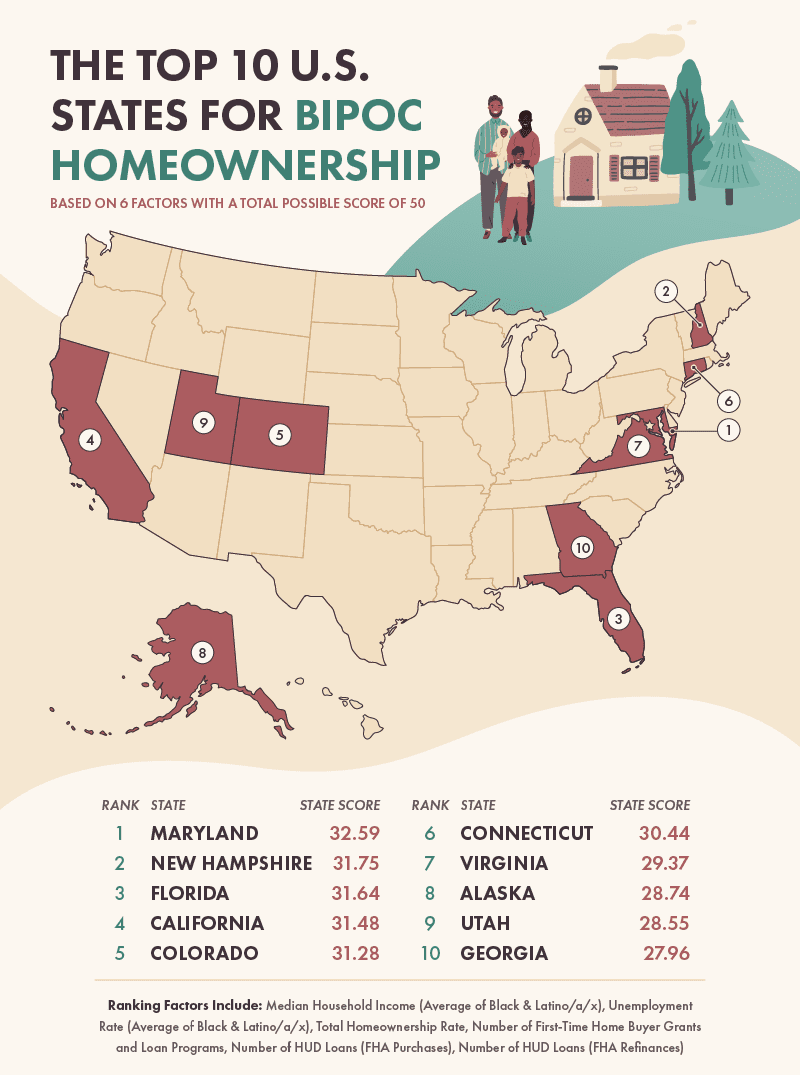
The best state for BIPOC homeownership is Maryland, largely due to high annual incomes and low unemployment rates for BIPOC. The median household income for BIPOC in Maryland is $70,171, surpassing all other states. For context, the national average household income for BIPOC is $46,859. Further, the unemployment rate for BIPOC in Maryland, 7.15%, is significantly lower than in other states. By comparison, the national average unemployment rate for BIPOC is 9.73%.
Other states landing in the top five include Florida, California and Colorado. Florida in particular has the second-highest number of FHA loans filed (after Texas) with a total of 6,790 loans. FHA loans are beneficial for lower-income buyers, seeking lower down payments and lower monthly mortgage insurance payments (in some cases) in comparison to conventional loans.
The Best & Worst States for BIPOC Homeownership
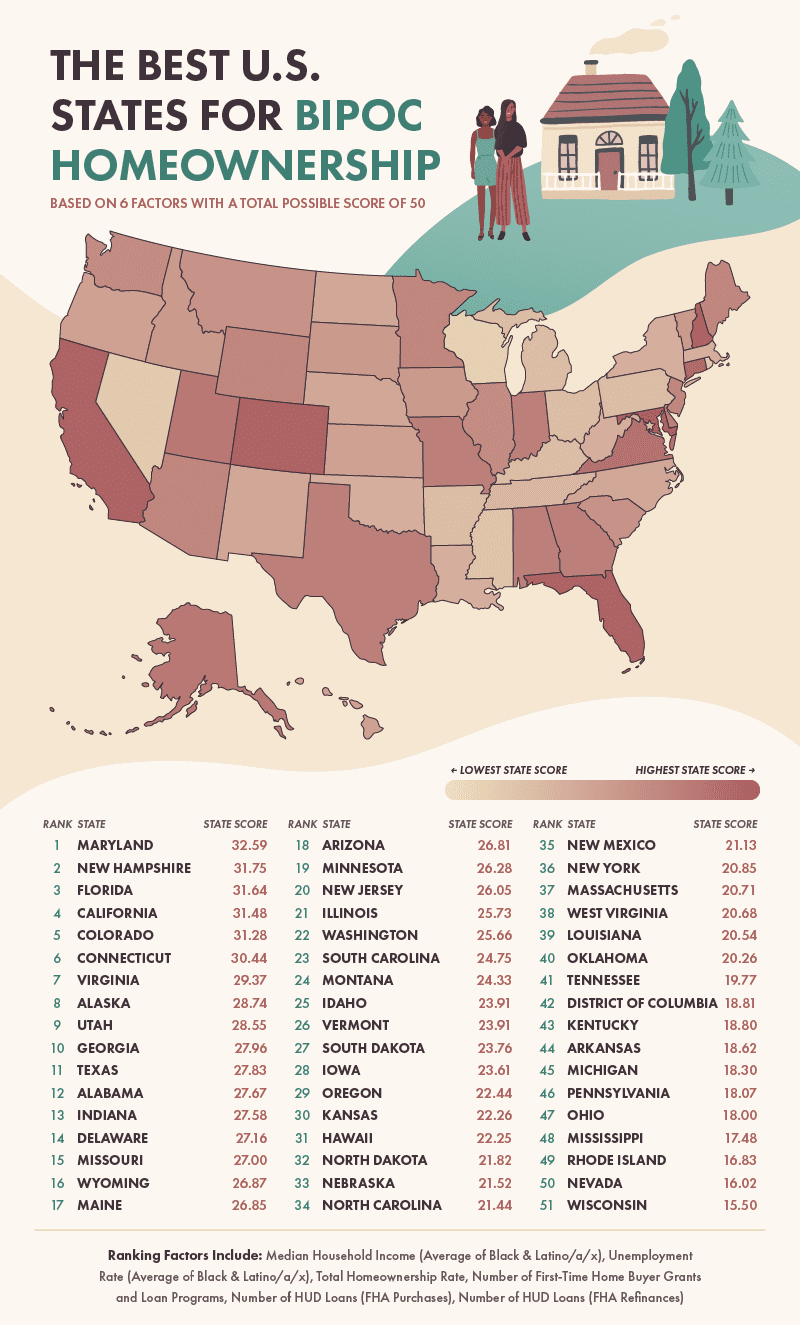
Georgia landed in the 10th spot in the ranking with a lower-than-average unemployment rate of 7.7% and 3,038 FHA loans filed. Notably, certain cities in Georgia have some of the lowest racial homeownership gaps in the country. At 21.7%, Augusta, Georgia has the fifth smallest gap in the U.S. between white homeownership rates and Black homeownership rates, according to Urban Institute data. Columbus, George and Atlanta, Georgia both have comparably small gaps as well, with 22.5% and 29.6% respectively.
Wisconsin, Nevada, Rhode Island and Mississippi landed in the bottom four states in our ranking, indicating these are a few of the states least conducive for BIPOC homeownership. Wisconsin, in particular, has a notably low median household income for BIPOC ($38,809), while its unemployment rate for BIPOC sits just below 14%. What’s more, the gap between white homeownership rates and Black homeownership rates in Milwaukee is over 40%.
U.S. Homeownership Broken Down by Race
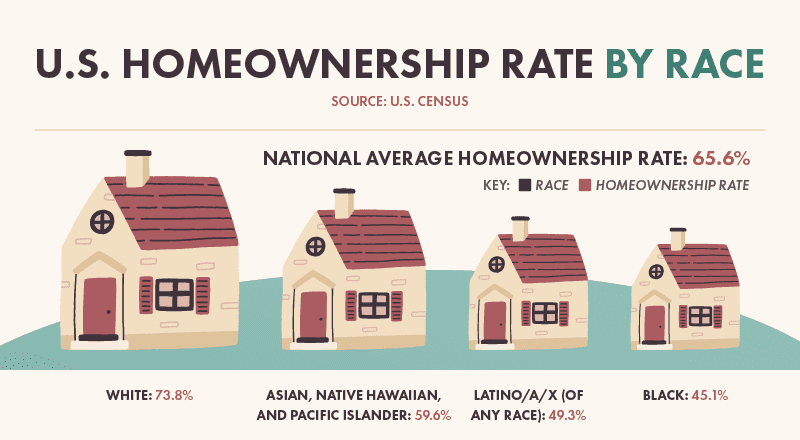
According to Marketwatch, the gap in homeownership rates between Black and white Americans has ranged between 20 and 30 percentage points for more than 100 years. BIPOC have historically had lower homeownership rates due to poor access, systemic oppression, discriminatory banking services and disproportionate disadvantages caused by the 2008 housing crisis.
Recent Census data shows that the average white homeownership rate in the U.S. hovers around 74%–a rate almost 12% above the national average, while the average Latino/a/x homeownership rate is 49.3% and the average Black homeownership rate is 45.1%, which is 28% and 37% below the national average, respectively.
Full Data
Owning a home is one of the most fundamental ways to accumulate wealth, which makes increasing BIPOC homeownership a significant goal in addressing wealth disparity as a whole in the U.S. For this reason, United Way NCA is knocking down financial barriers for 100,000 area residents so that they have access to stable and affordable housing, as well as the economic opportunity and resources they need to build a foundation for the future.
Interested in diving deeper into the numbers for the top states for BIPOC homeownership? We’ve compiled our full data study for all 50 U.S. states and the District of Columbia into the interactive data table below. Search for the state you call home or click on the heading of each column to sort by that category!