Amid mass layoffs across both the public and private sectors in recent years, millions of Americans are still navigating an uncertain job market. For many in the ALICE population, losing a job or changing careers isn’t just a temporary disruption. It can quickly become a financial emergency. For those without much savings to fall back on, even a short stretch of unemployment can set off a chain reaction of stress, tough trade-offs, and debt.
In this study, we ran a national survey of 1,000 recent (within the last year) and current job seekers in the U.S. to answer the question: How long does it take to find a job in 2026, and what does it cost, both in time and financial strain? We dug into how many applications people submitted, how many interviews they sat through, and how many hours a day they’ve dedicated to job hunting.
Beyond that, we spotlight the lived experiences of job seekers who didn’t have a safety net: those who burned through savings, relied on resources like unemployment benefits, or took on credit card debt just to get by. Together, these survey results offer a human-centered look at what it takes to stay afloat and eventually get hired in today’s job market.
Key Findings
- Washington, D.C. has the second-longest average unemployment duration in the country at 6.6 months, while Maryland has the fifth-longest at 5.9 months.
- The average job search takes 6.6 months, suggesting many people are spending over half a year job hunting before landing a new job.
- On average, job seekers say they applied to 62.6 jobs and spent roughly 44 minutes on each application.
- Tech job seekers face the longest search of any industry by a wide margin, averaging 9.7 months (over 3 months longer than the overall average) and more than 100 applications during their job hunt.
- Younger job seekers are applying to more jobs: Gen Z reports the highest number of applications (75.8), compared with Millennials (57.3), Gen X (52.5), and Baby Boomers (44.3).
- During their job search, job seekers submitted 62.6 applications, but landed just five interviews in total from those applications.
- Nearly half of job seekers (45%) say their savings would run out in under a month if their income stopped tomorrow, and more than two-thirds (68%) say they have less than two months of reserves — yet the average job search drags on for more than six months.
- When asked how their job search affected their finances, 55.6% said they used up savings, 55.1% cut spending on essentials like food, medicine, and utilities, and 42.6% borrowed money from family or friends. 38.0% missed bill payments or took on credit card debt to get by.
How Long Does the Average Job Search Take in 2026?
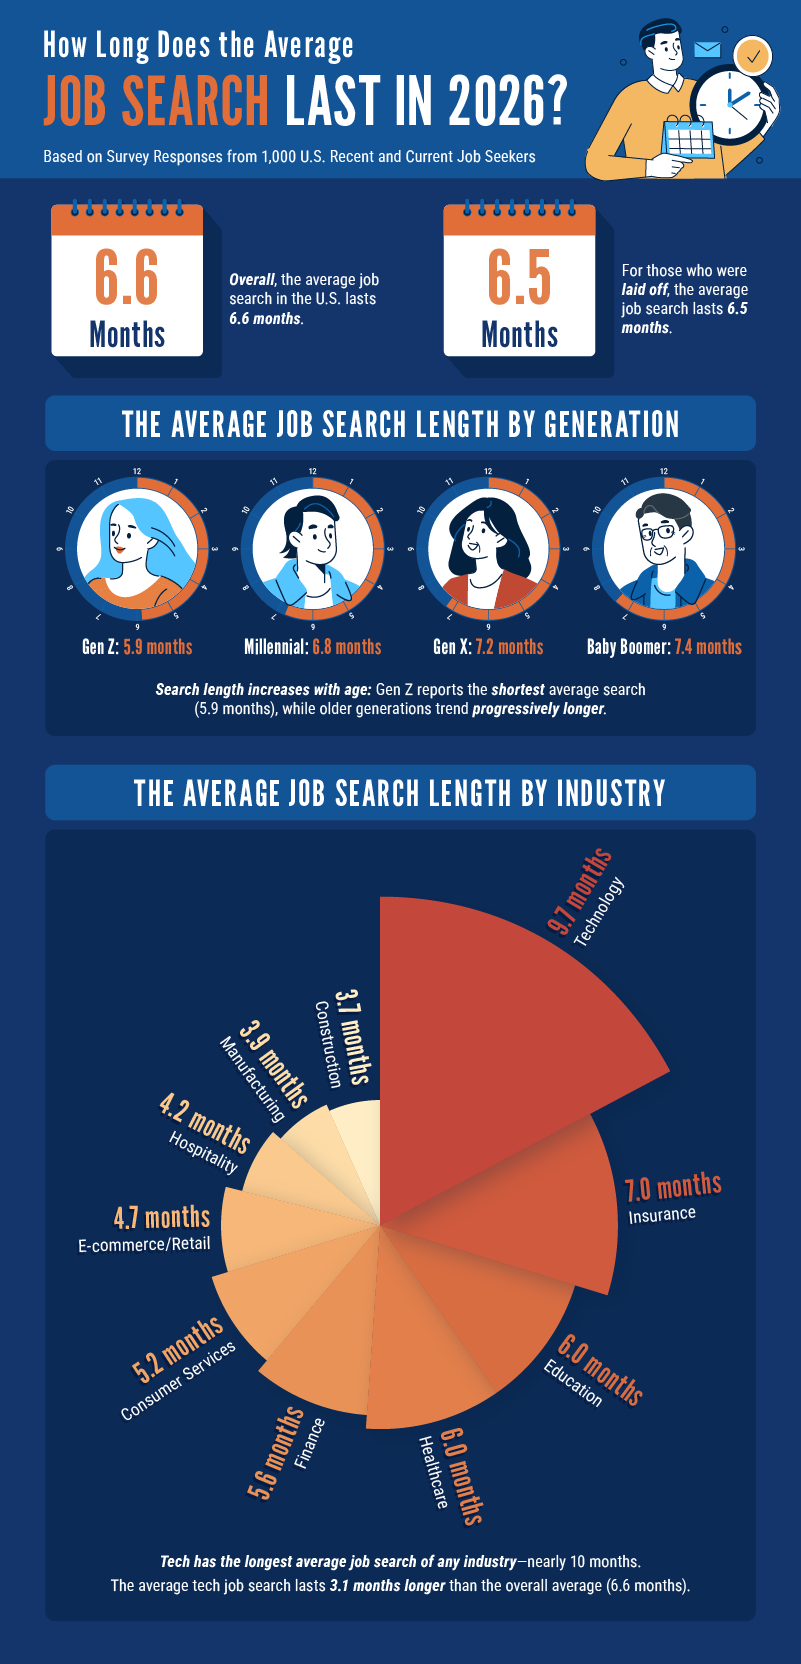
For many Americans, finding a new job is not a quick reset. On average, respondents said their job search lasted 28.5 weeks, or about 6.6 months, meaning many are spending more than half a year looking for work before landing a new role. Those who were laid off reported nearly the same timeline, with an average search length of 6.5 months. Taken together, these findings suggest that unemployment is rarely just a short-term gap.
The data also shows that some groups are facing even longer searches than others. Job search length tends to rise with age, from 5.9 months on average for Gen Z to 6.8 months for Millennials, 7.2 months for Gen X, and 7.4 months for Baby Boomers.
The industry someone works in matters, too. Construction, manufacturing, and hospitality workers reported the shortest searches, averaging between 3.7 and 4.2 months. However, those in the Tech industry stand out in the opposite direction: with job searches lasting an average of 9.7 months. That is over three months longer than the overall average and the longest of any industry by a wide margin.
This reflects how crowded the Tech industry has become after years of layoffs, which have put a large number of experienced workers back into the applicant pool. At the same time, companies appear to be hiring more selectively, with tighter budgets and growing demand for specialized AI-related skills, leaving some traditional Tech candidates competing for fewer openings.
How Many Applications Are Job Hunters Submitting?
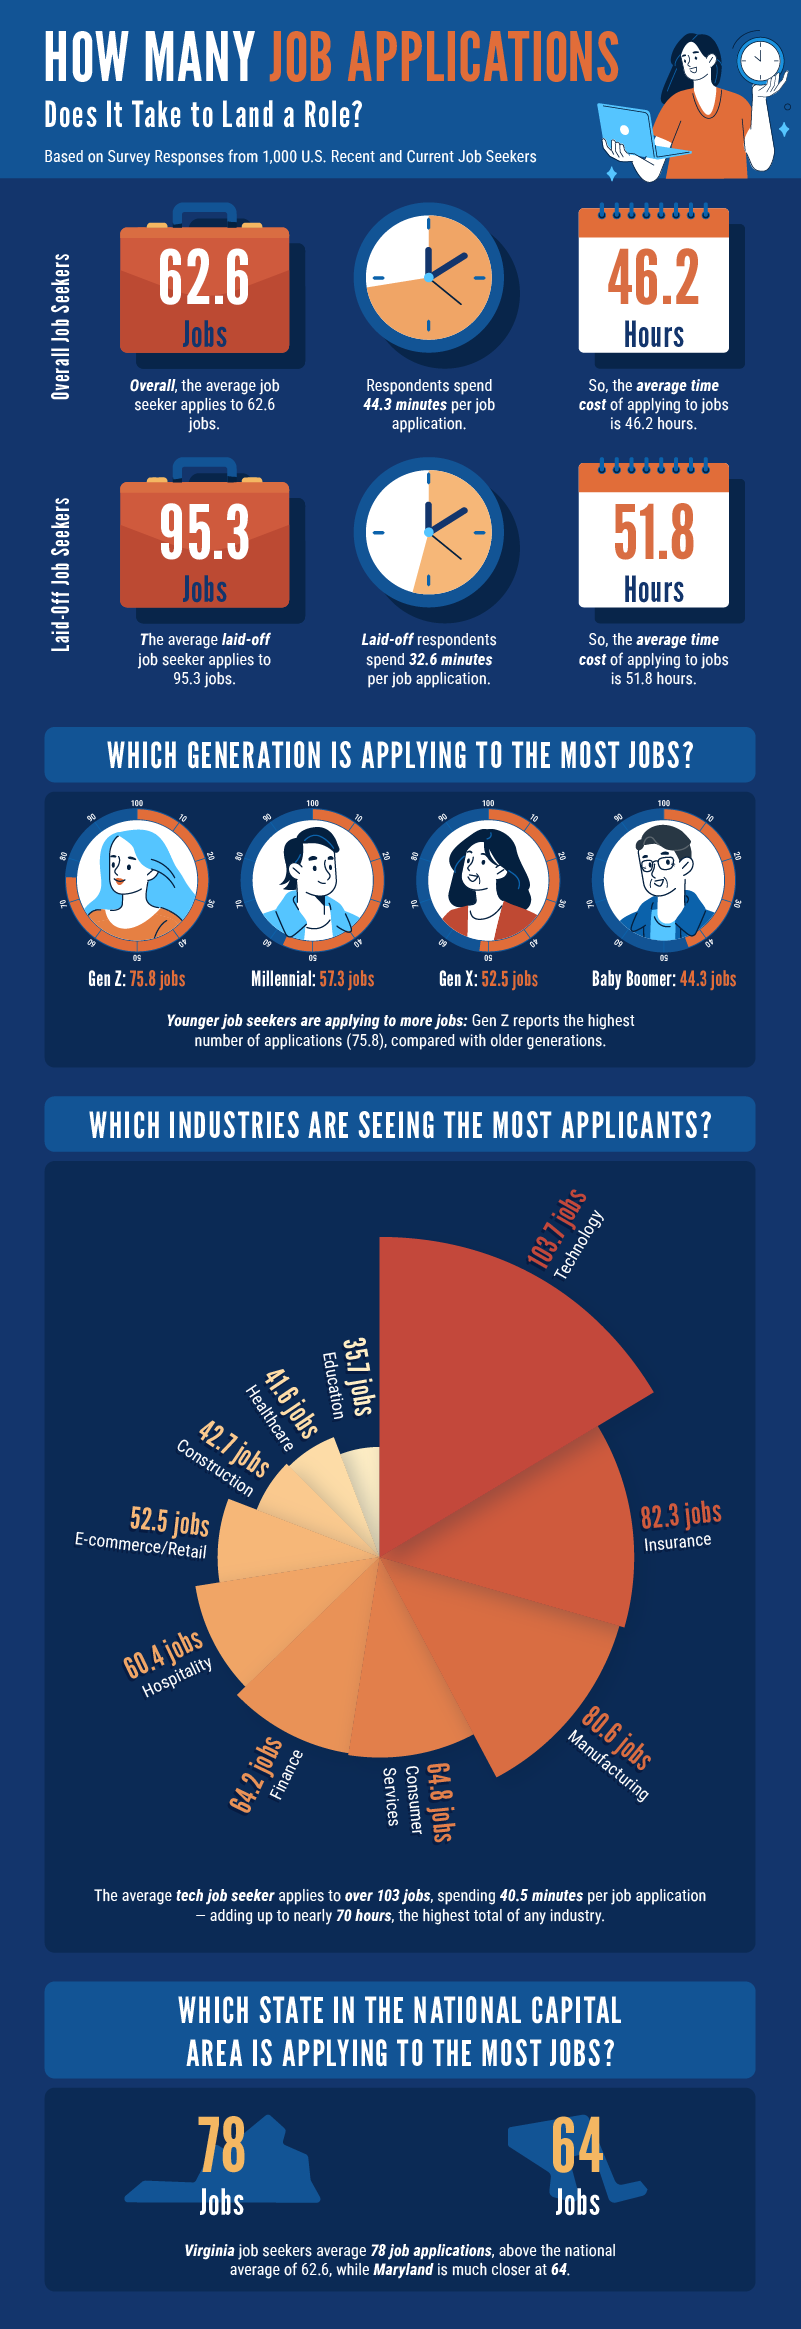
On top of how long the search takes, the application process itself has become a major lift. On average, job seekers said they submitted 62.6 job applications and spent about 44 minutes on each one. That adds up to 46.2 hours of application time alone—more than a full 40-hour work week spent just filling out forms, uploading resumes, and tailoring materials before even getting hired. For many people, job hunting has become its own unpaid job, requiring steady time and energy with no guarantee of a response.
That burden is even heavier for some groups. Respondents who were laid off reported applying to 95.3 jobs on average, far more than the overall sample, though they spent less time on each application, about 32.6 minutes, suggesting a faster, higher-volume approach. That may reflect the urgency many laid-off workers feel to get income coming back in quickly.
Younger job seekers are also casting a wider net. Gen Z respondents reported the highest number of job applications, at 75.8 on average, compared with 57.3 for Millennials, 52.5 for Gen X, and 44.3 for Baby Boomers. With graduation season bringing a new wave of entry-level candidates into the market, that finding is a reminder that many young job seekers may need to brace for a longer, more demanding search than expected. That lines up with recent reporting that Gen Z is having an especially hard time breaking in right now, as employers pull back on entry-level hiring and favor candidates who can step in with less training.
Again, industry matters, too. Education (35.7 applications) and healthcare workers (41.6) reported the lowest job application volumes, while technology stood out by a wide margin. Tech job seekers said they submitted 103.7 applications on average and spent 69.9 total hours applying — the highest time cost of any industry.
States in our National Capital Area also appear to demand more from job seekers than the average market. Maryland job seekers reported submitting 63.8 job applications on average, while Virginia respondents reported 78. Both also exceeded the overall average time cost, with Maryland job seekers spending 55.3 total hours applying and Virginia job seekers spending 52.1 hours. That may be one sign of a more competitive regional job market, especially after federal workforce cuts added pressure in D.C., Maryland, and Virginia. When more experienced workers are suddenly all looking at once, it can take more applications (and more time) to stand out.
Job Searching Has Become a Full-Time Job
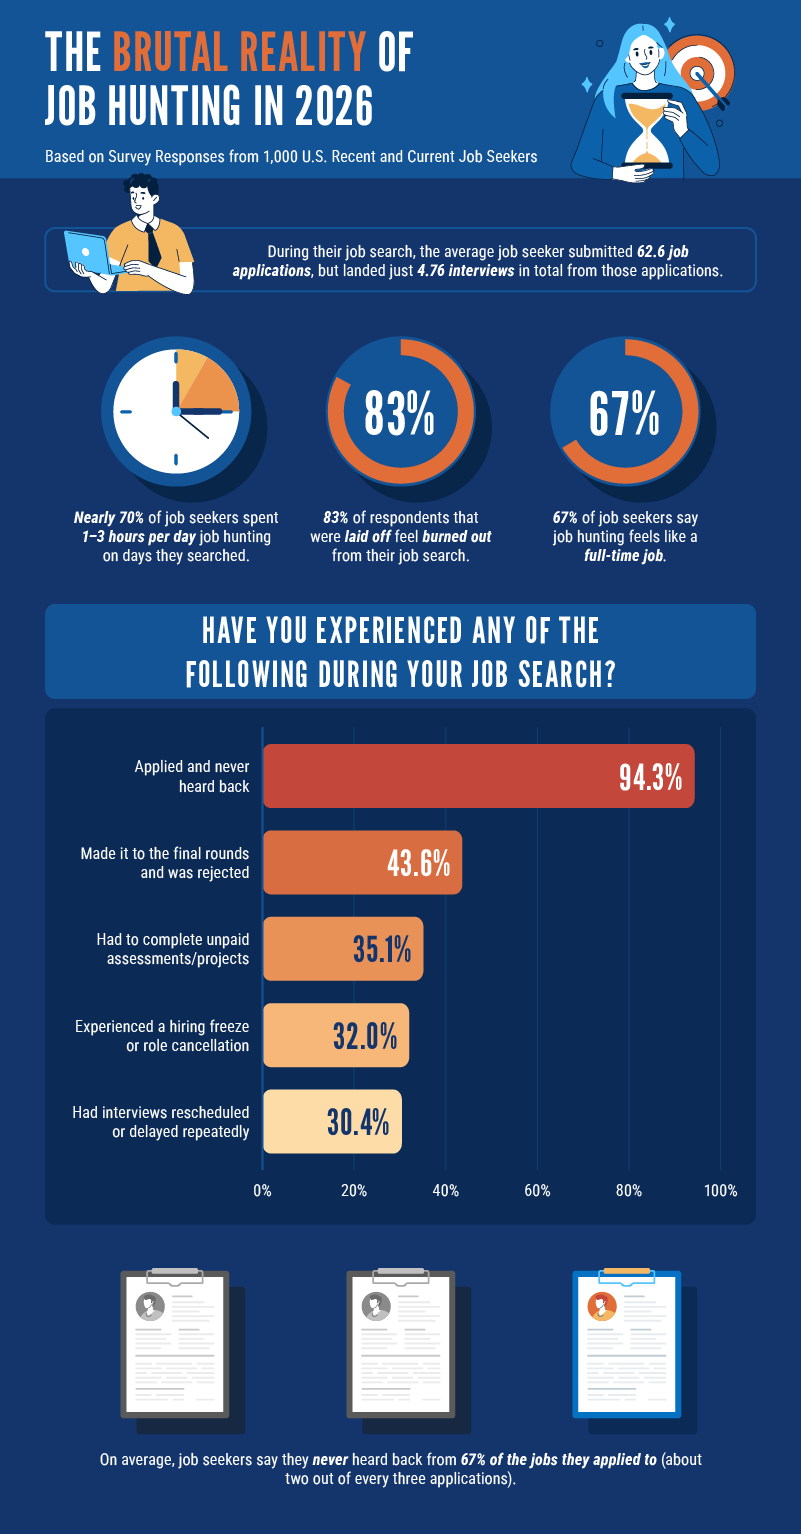
If job searching feels exhausting, the numbers back that up. On average, respondents in our survey said they submitted 62.6 job applications but landed just 4.76 interviews from those efforts. Most also said they spend 1 to 3 hours a day job hunting on the days they search, which helps explain why so many people describe the process as draining. In fact, nearly 80% of respondents said they feel burned out from their job search, and that figure rises to 83% among those who were laid off. More than two-thirds of respondents, 67%, said job searching feels like taking on a full-time job.
A big part of that burnout appears to come from how much effort goes unrewarded. Ghosting is nearly universal: 94.3% of respondents said they applied to jobs and never heard back during their search, and on average, they said 67% of their applications got no response at all — about two out of every three. Even getting deeper into the process often doesn’t lead anywhere. More than four in 10 respondents, 43.6%, said they made it to the final rounds of interviews and were still rejected, while 35.1% said they were asked to complete unpaid assessments or projects for employers.
Job Searches Are Draining People’s Safety Nets
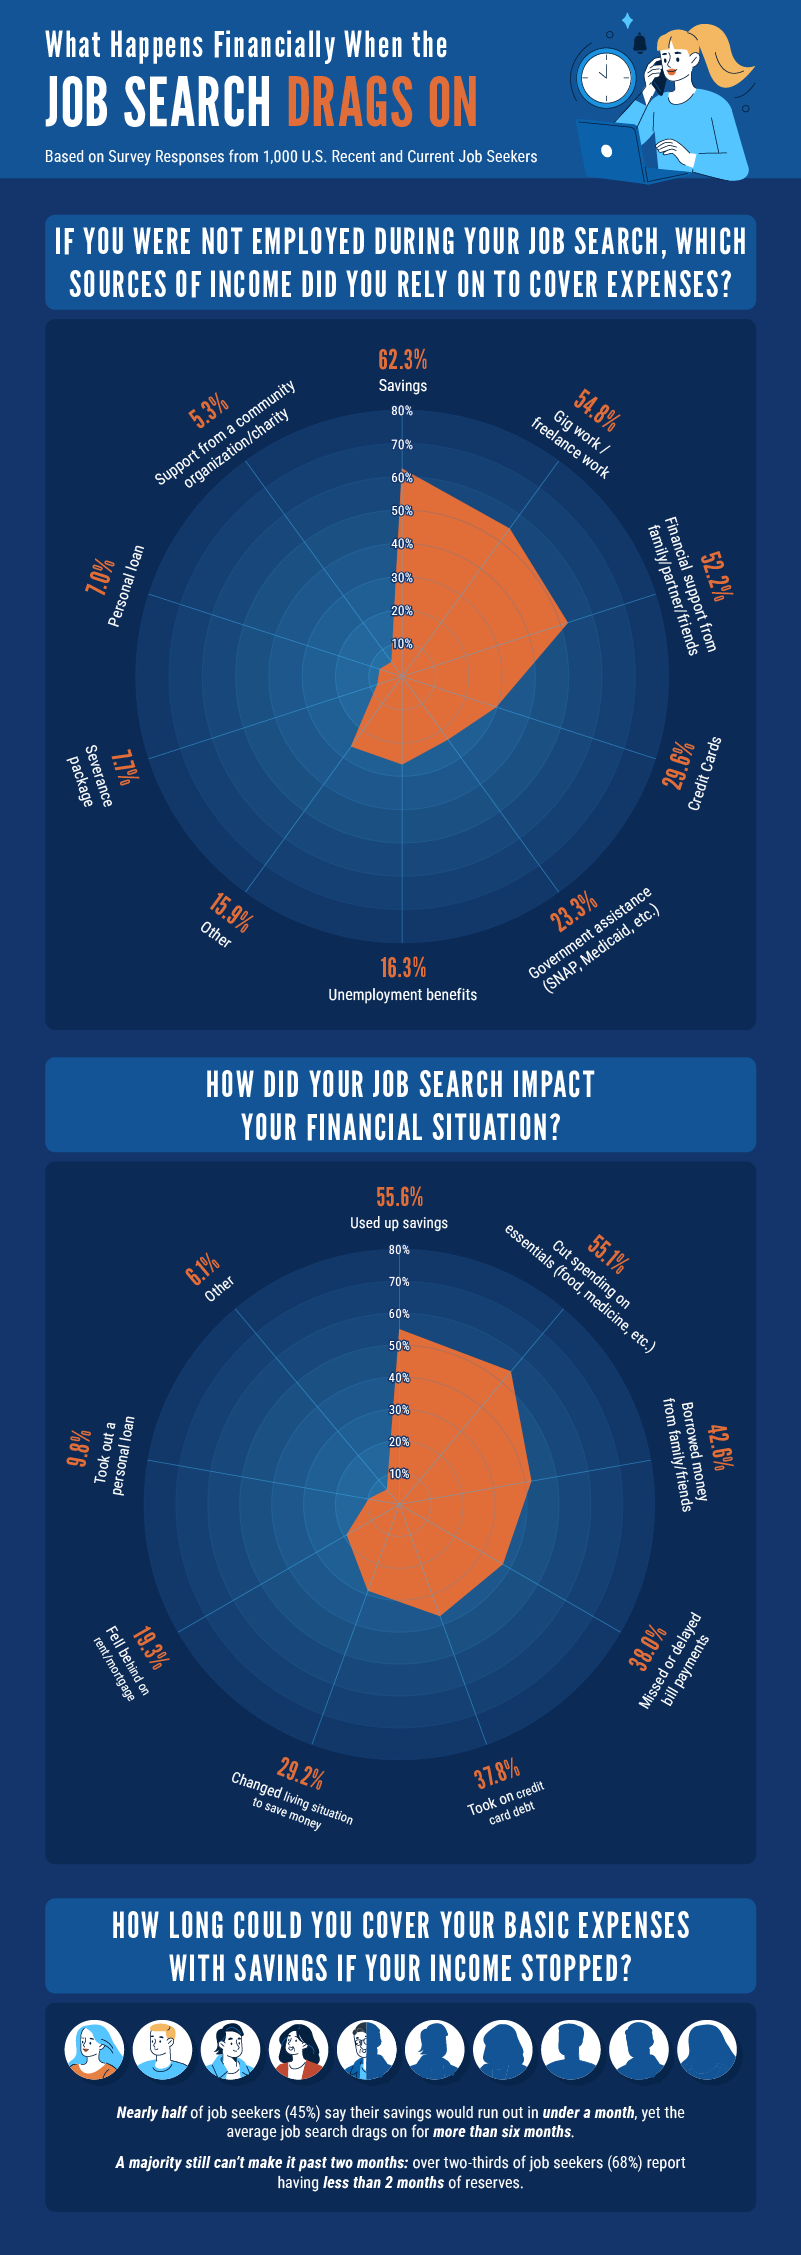
For many job seekers, unemployment is not a period of rest between roles. It is a scramble to keep paying the bills. Among respondents who were not employed during their job search, nearly two-thirds (62.3%) said they relied on savings to cover expenses, making it the most common financial lifeline. More than half (54.8%) said they turned to gig or freelance work, suggesting that many are trying to patch together income however they can rather than stepping away from work entirely. Personal support systems are also doing a lot of the heavy lifting: 52.2% said they relied on financial help from family, partners, or friends. At the same time, many are taking on new financial risk just to get through the search, with 30% using credit cards, 23.3% relying on government assistance, and 16.3% drawing unemployment benefits.
That financial strain shows up quickly in the tradeoffs people are forced to make. When asked how their job search impacted their finances, more than half of job seekers said their search led them to use up savings (55.6%) or cut spending on essentials like food, medicine, and utilities (55.1%). Others said they borrowed money from family or friends (42.6%), missed or delayed bill payments (38.0%), or took on credit card debt (37.8%). Nearly 3 in 10 (29%) changed their living situation to save money, and almost 20% fell behind on rent or mortgage payments.
These pressures are even more striking when compared with how little cushion most people have. Nearly half of job seekers (45%) said their savings would run out in under a month if their income stopped, and 68.3% said they would not make it past two months. Only 16% said they could cover six months or more of basic expenses, even though the average job search in our survey lasts longer than six months.
How Long Does Unemployment Last in Each State?
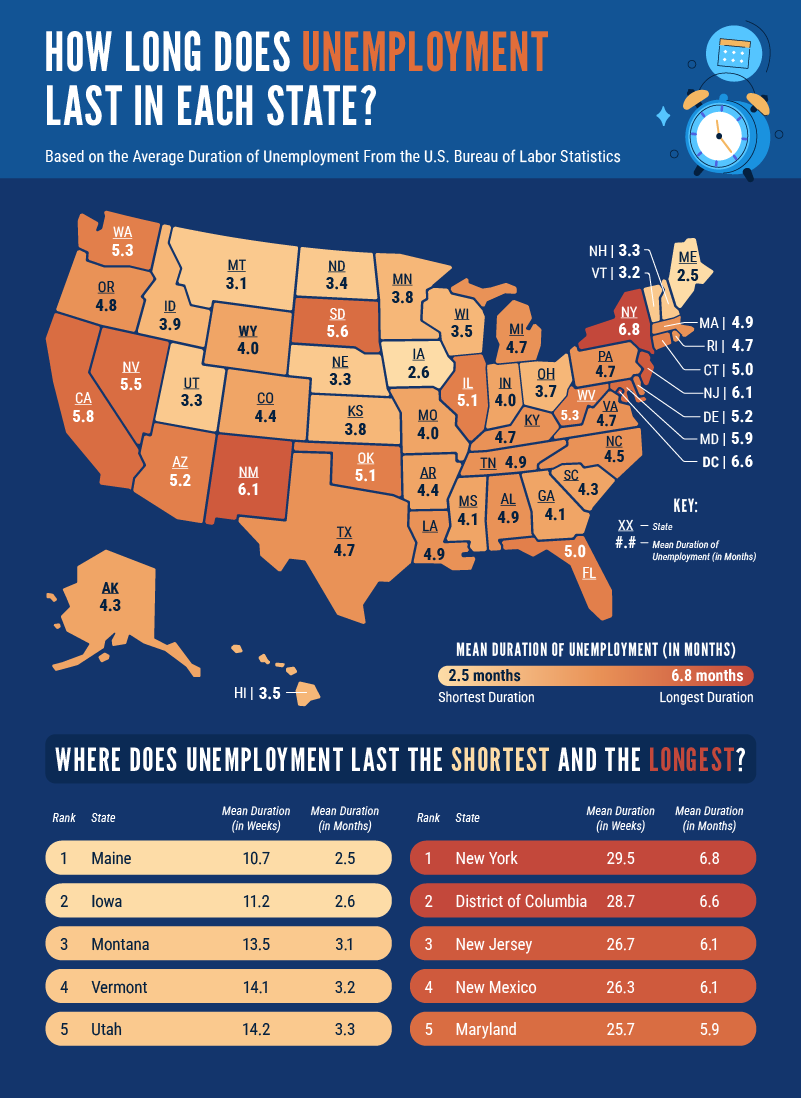
To add local context to our study, we also looked at state-by-state unemployment duration using data from the U.S. Bureau of Labor Statistics. The shortest average unemployment spells are concentrated in a handful of states where workers appear to be getting back to work relatively quickly. Maine (#1), Iowa (#2), Montana (#3), Vermont (#4), and Utah (#5) all have average unemployment durations of just 2.5 to 3.3 months.
On the other end of the spectrum, New York (#1), D.C. (#2), New Jersey (#3), New Mexico (#4), and Maryland (#5) have the longest average unemployment durations in the country, ranging from 5.9 to 6.8 months. In the National Capital Area specifically, D.C. ranks second nationally at 6.6 months of unemployment, while Maryland ranks fifth at 5.9 months.
There are a few reasons D.C. and Maryland may be landing so high. One likely factor is the region’s dependence on federal employment: research shows that D.C., Maryland, and Virginia together lost around 22,100 federal jobs from January through May 2025, adding pressure to an already competitive regional labor market. That strain is especially important in a region where many households were already living close to the edge. According to Maryland’s 2025 ALICE report, 39% of households in the state are living below the ALICE Threshold, meaning they were either in poverty or earning less than what it takes to afford the basics where they live. In Washington D.C.’s 2025 ALICE report, that figure was 33%. In other words, long periods of unemployment are hitting many households that were already struggling to cover essentials like housing, food, child care, health care, and transportation, even before a paycheck disappeared.
How Long Does Unemployment Last by Race?
Lastly, we looked at average unemployment duration by race and gender also using data from the U.S. Bureau of Labor Statistics.
The clearest pattern in the data indicates racial disparity:
- Black or African American workers face the longest average unemployment duration at 6.2 months
- Asian workers follow at 5.5 months
- Hispanic or Latino workers average 5.2 months
- White workers have the shortest average unemployment duration at 5.0 months
Gender differences are smaller overall, but they look different depending on the group. Among white workers, men face slightly longer unemployment than women, at 5.2 months versus 4.9 months. Among Black workers, there is essentially no gender gap, with both men and women averaging 6.2 months. Asian workers show a wider split, with men averaging 5.8 months unemployed compared with 5.1 months for women. Among Hispanic or Latino workers, the pattern flips: women average 5.5 months unemployed, compared with 4.9 months for men.
Closing Thoughts
For many Americans, finding a job in 2026 is not a quick or straightforward process. Our survey found that the average job search now lasts 6.6 months, requires 62.6 applications, and eats up more than 46 hours in application time alone.
Along the way, many job seekers are burning through savings, cutting back on essentials, and dealing with the emotional toll of ghosting, rejection, and burnout. The picture that emerges is one of a job market that demands persistence. As workers look ahead, the findings point to a need for more realistic expectations, stronger financial preparation where possible, and more support for people navigating long stretches of unemployment.
For families in the ALICE (Asset Limited, Income Constrained, Employed) population, those challenges can be even more acute. When households are already living paycheck to paycheck, a short period without income can quickly spiral into missed bills, housing instability, and the loss of basic necessities.
United Way of the National Capital Area works to support workers and families across the region through programs and partnerships that strengthen financial security and connect people to help when they need it most. If you want to support neighbors facing job loss or financial hardship, you can donate, volunteer, or find other ways to get involved with United Way NCA’s work.
Methodology
This study is based on a national survey of 1,000 recent and current job seekers in the U.S., conducted from February 26, 2026, to March 7, 2026. For this study, recent job seekers are defined as people who had recently gone through a job search and had either started a new job within the past year or were scheduled to start a new job soon.
To add labor-market context beyond the survey, we also analyzed unemployment-duration data from the U.S. Bureau of Labor Statistics (BLS). State-level unemployment duration figures came from the 2024 Geographic Profile of Employment and Unemployment, which provides Current Population Survey data for states and the District of Columbia. Race- and gender-based unemployment duration figures came from the U.S. Bureau of Labor Statistics’ Current Population Survey annual averages for 2025. In BLS data, duration of unemployment measures how long officially unemployed people have been unemployed, while not working and actively looking for work.
Fair Use
You are welcome to use, reference, and share non-commercial excerpts of this study with proper attribution. If you cite or cover our findings, please link back to this page so readers can view the full methodology, charts, and context.