Both average and minimum wage earners in the U.S. struggle to meet one of the most basic human needs—food, a challenge tied closely to cost-of-living increases. Across the country, high grocery prices have reached a national weekly average of $152.89 for an individual.For some workers, especially the ALICE (Asset Limited, Income Constrained, Employed) population, even wages above the Federal Poverty Line do not cover this necessity.
In the spirit of United Way of the National Capital Area’s commitment to advancing economic opportunity through Financial Empowerment Centers, our latest exploration delves into the fabric of economic reality across the United States. By dissecting the economic hurdles faced in our community, we aim to ignite a conversation around fair wages, equitable access to resources, and the steps we can collectively take toward ensuring food security for all.
To help better understand this economic issue, we analyzed data from the U.S. Census Bureau and the Department of Labor. Find out below which states need the most support to help people get food on the table.
The Time Cost of Groceries: Average vs. Minimum Wage Earners

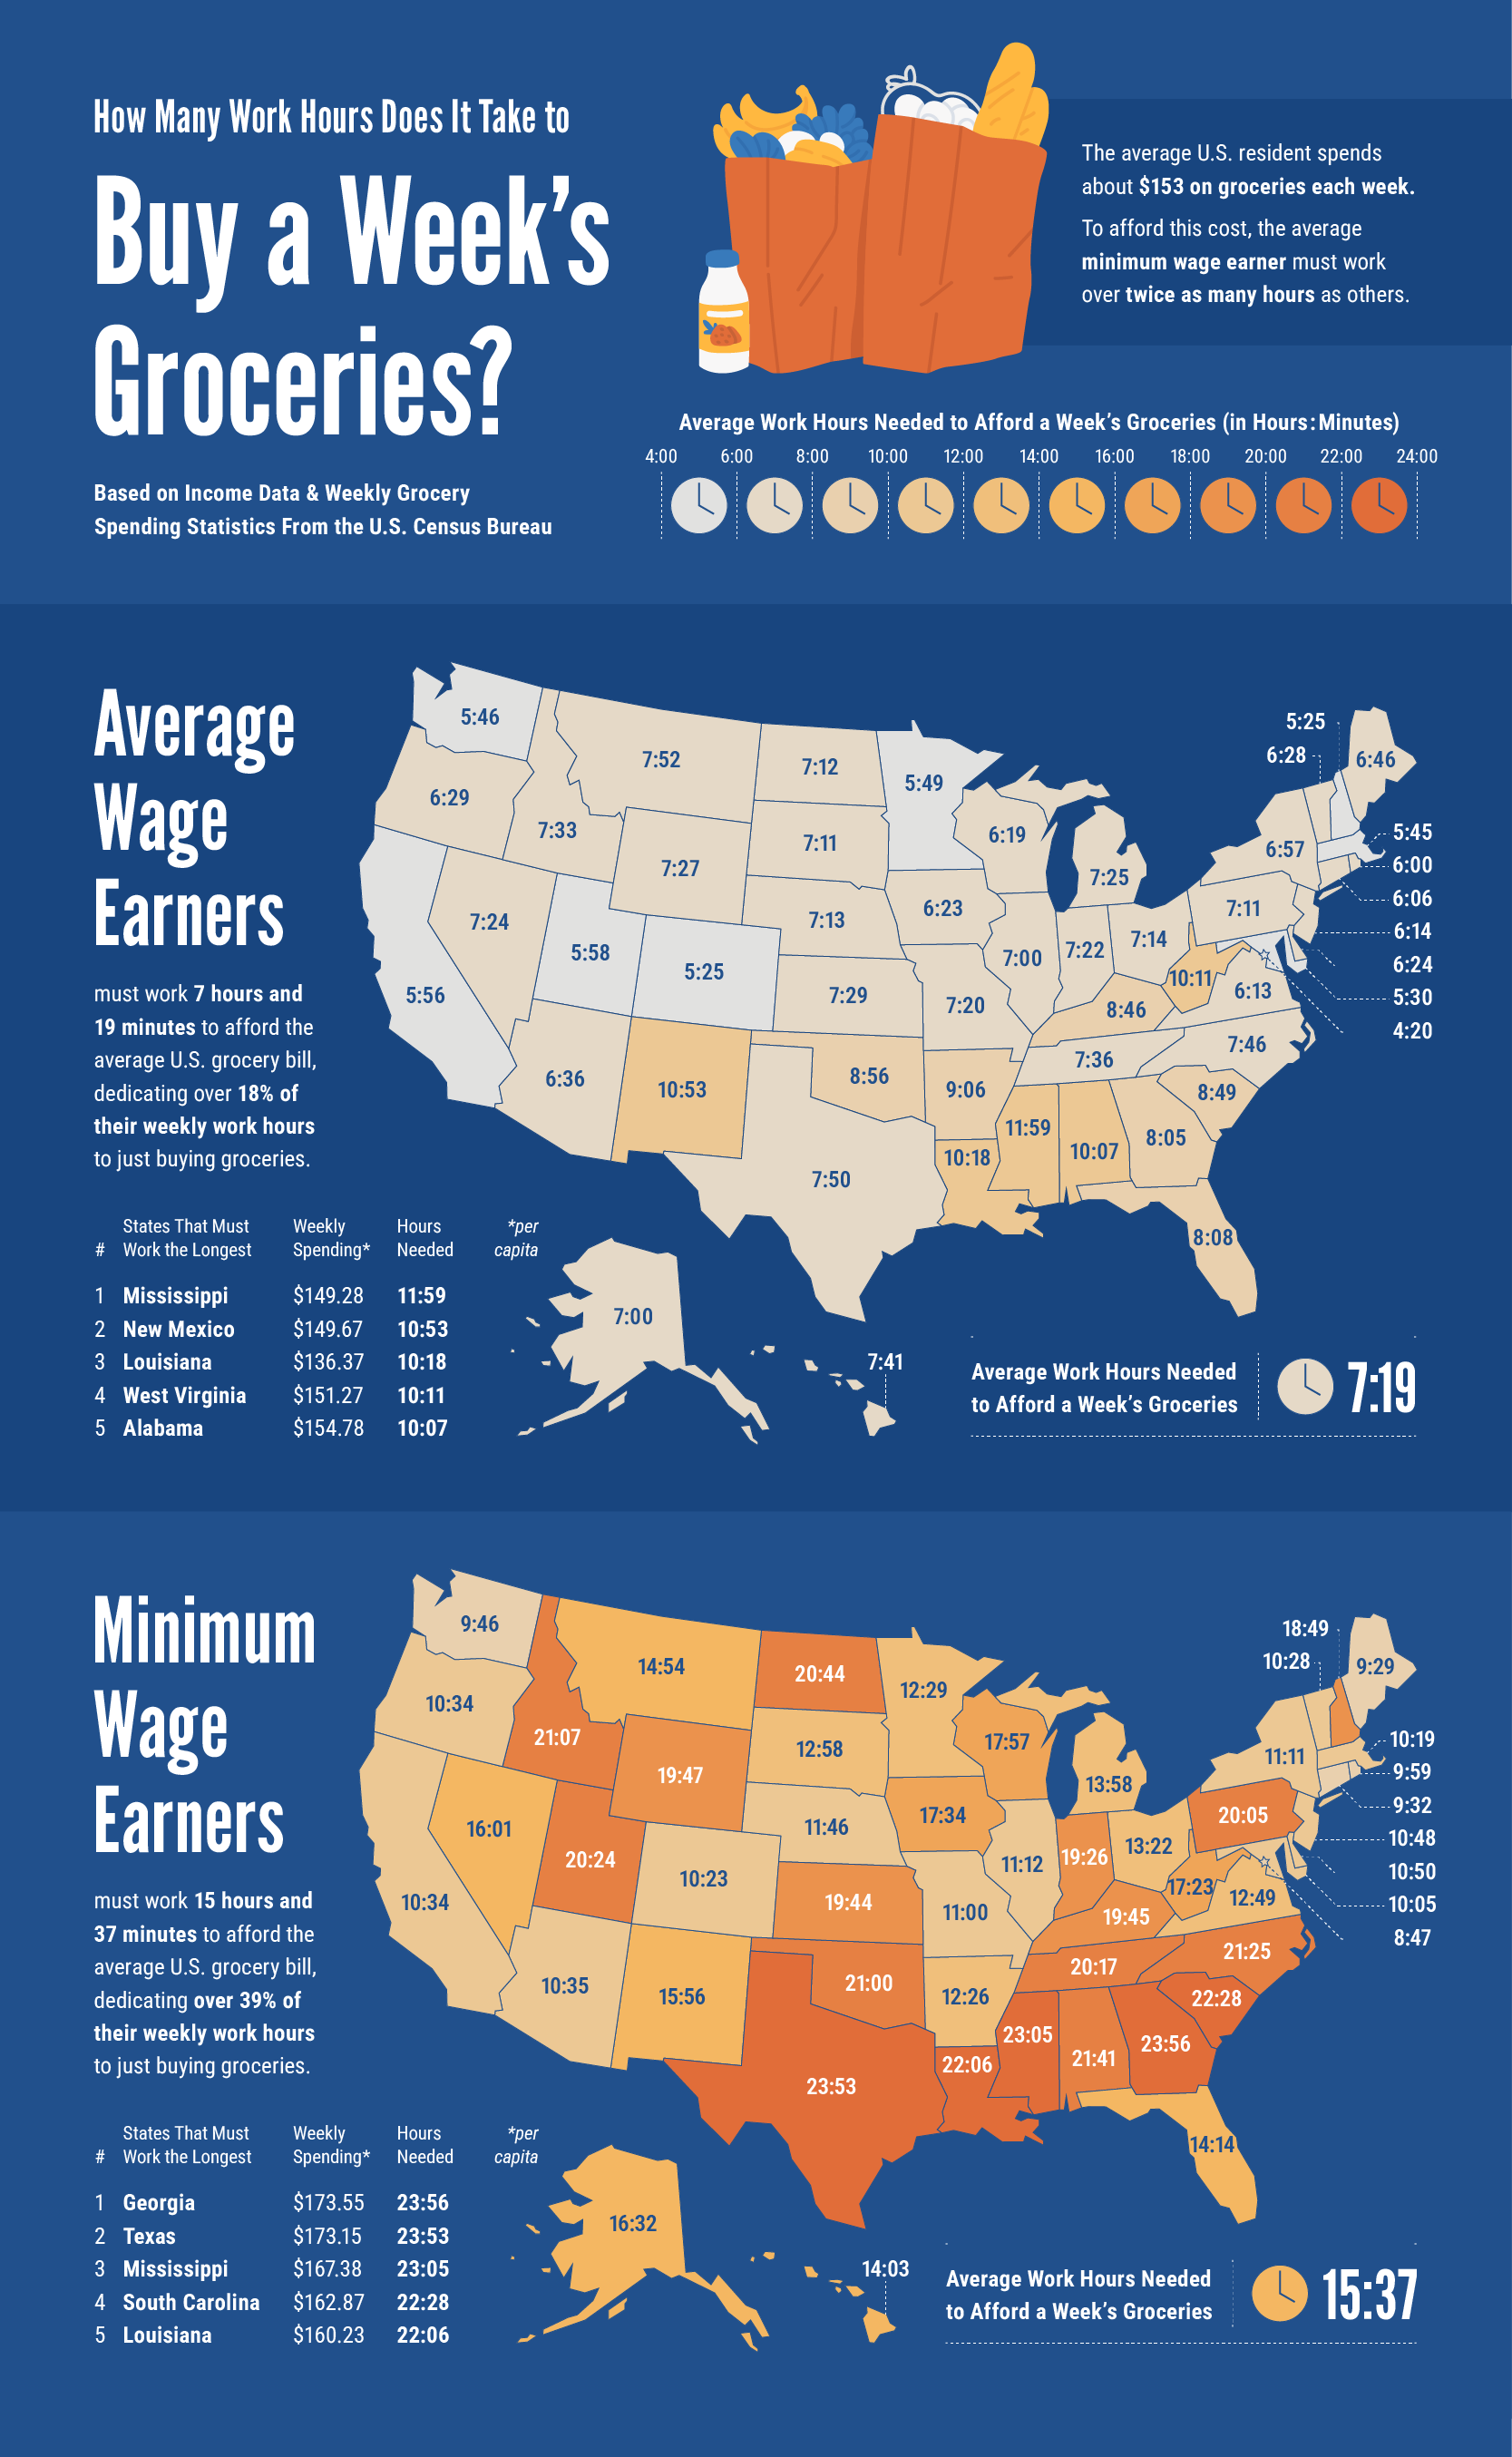
Based on the national average cost of weekly groceries for an individual, $152.89, average wage earners need to work about 7 hours and 19 minutes a week to meet that cost. For minimum wage workers, the time cost is more than double; they need to work 15 hours and 37 minutes a week to cover the cost of food. While average earners can generally cover their grocery bill in less than a day’s work, minimum wage earners need nearly two days. This disparity reveals the actual cost of high grocery prices combined with low minimum wages in the U.S. generally, although the gaps vary from state to state.
The South struggles the most with meeting food costs in a timely manner. Of the 10 states whose average wage earners must work the most to cover food, 9 are in the South. This list is topped by Mississippi, a state whose average wage earners need to work nearly 12 hours (11 hours and 59 minutes) a week to cover the cost of food.
Similarly, 8 of the 10 states whose minimum wage earners must work the most to pay for food are in the South. Georgia is at the top of that list, needing to work an astonishing 23 hours and 56 minutes to procure their weekly groceries. That’s almost 3 entire workdays (60% of the workweek).
The disparity between average and minimum wage earners is striking in the heart of our communities—Maryland, Virginia, and the District of Columbia. In Maryland, average wage earners are paid enough to buy groceries in 5 and a half hours. For minimum wage earners, the gap widens considerably. They must work 10 hours and 5 minutes to afford basic grocery needs, 83% longer than average wage earners in Maryland.
Virginia presents a similar story, with both groups of workers dedicating a significant portion of their labor to securing food. Average wage earners spend 6 hours and 13 minutes a week working to buy groceries. However, it’s the minimum wage earners who find themselves in a more precarious situation, needing to work 106% longer or 12 hours and 49 minutes total to afford the same groceries that their average wage counterparts can.
Even where the time cost of working for groceries is the lowest for both groups of workers, like in the District of Columbia (D.C.), the grocery bill is still a daunting challenge for many. For average wage earners in D.C., it takes 4 hours and 20 minutes to cover food. Minimum wage earners need to work 8 hours and 47 minutes, which is 103% longer. This also means all minimum wage earners in the country must spend more than one full day’s work a week just for food.
The U.S. States Where Families Can’t Afford Groceries
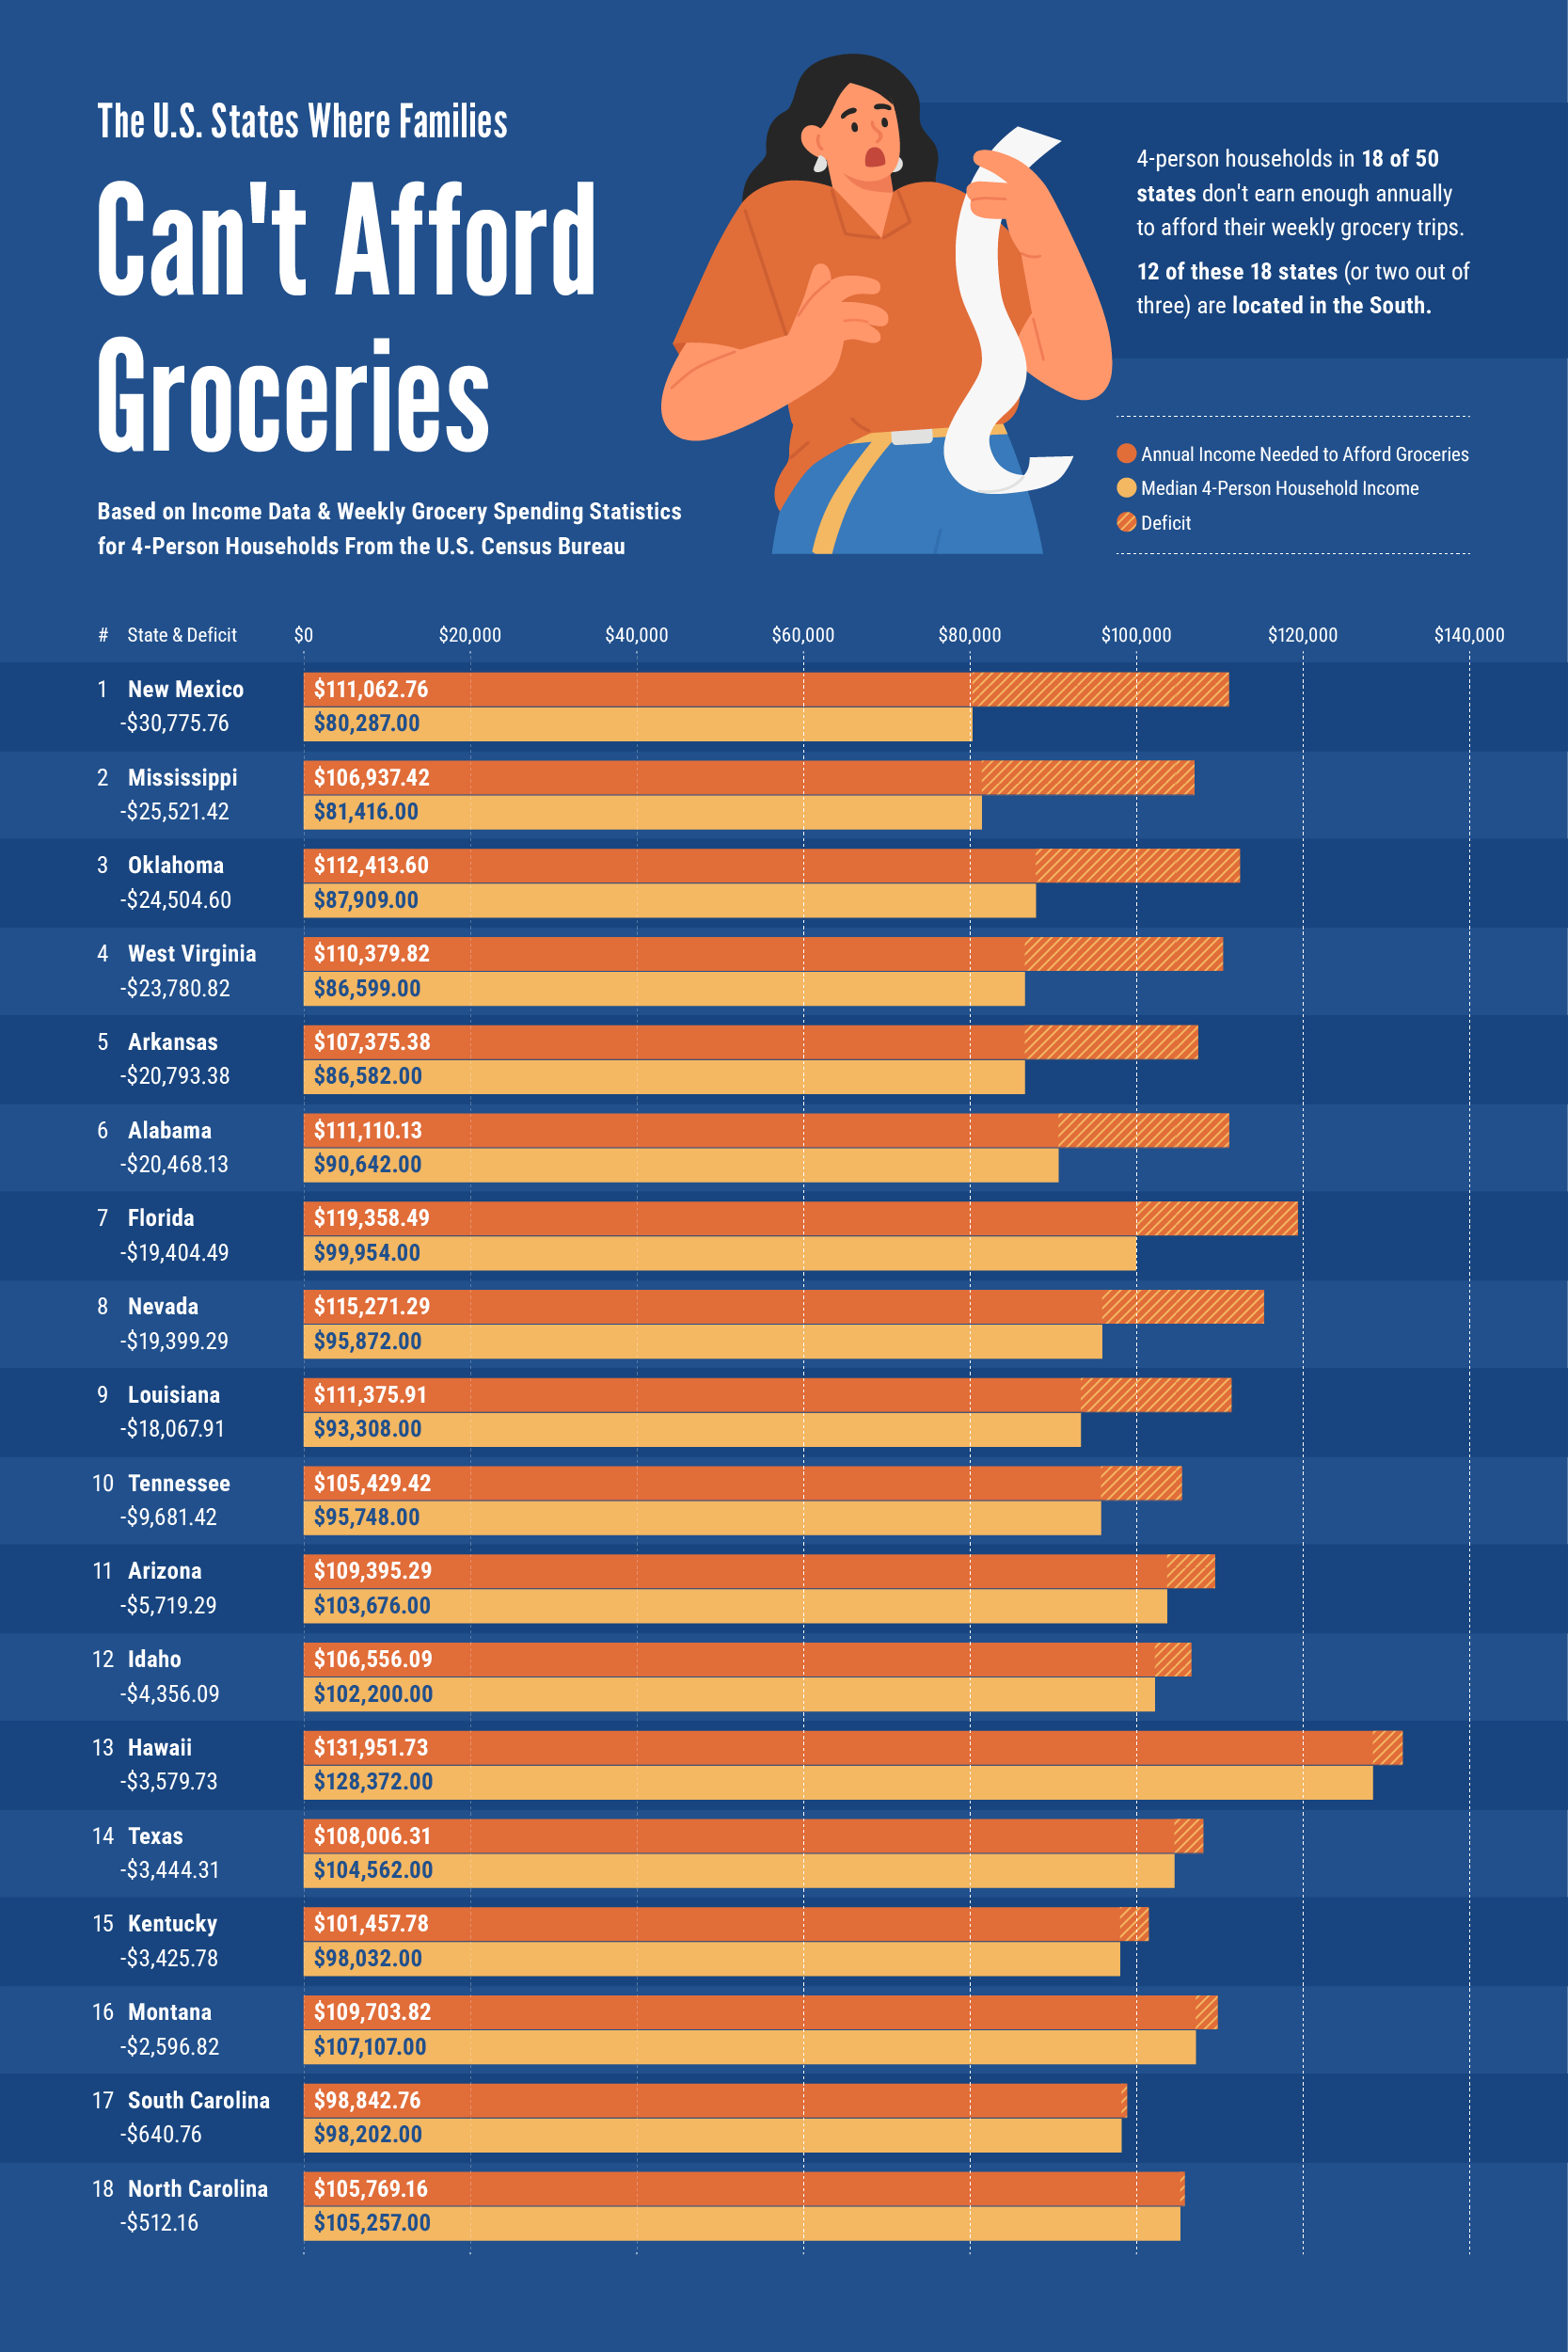
When aggregating the weekly cost of groceries for a four-person household over a year and comparing it to the actual median income of a four-person household in each state to uncover if families in the U.S. can reasonably afford groceries for a year, a startling picture emerges. 18 states in the U.S. had an average that results in a deficit, meaning sacrifices are being made across the country—whether it’s spending less on food, going hungry, or having to reallocate funds from other categories.
The South once again struggles with these deficits the most in the country. Of the 18 highest deficits, 12 are from states in the South. That’s about ⅔ of the largest gaps coming from the same region of the U.S. However, the largest disparity for families trying to afford groceries is in New Mexico, where the actual median income falls $30,776 short of covering the annual cost of groceries for a family of four. In the South, it’s Mississippi, whose actual median income to grocery costs deficit for a family of four is $25,521.
A third of these states, including New Mexico and Mississippi, are in a deficit higher than $20,000; the others are Oklahoma, West Virginia, Arkansas, and Alabama. Another 3 (Florida, Nevada, and Louisiana) are in the red by about $18,000 – $20,000.
While the average four-person household in D.C., Maryland, and Virginia earns enough to afford their weekly grocery trip, the individuals living alone in these states may experience a different story.
The States Where Individuals Can’t Afford Groceries
With four-person households in the red in 18 states, individual costs across the country raise that number to 42 states in the red. From New Mexico individual residents being $29,733 short to Rhode Island individual residents being $30 shy of comfortably covering their annual grocery bill, the full interactive data table above displays the 42 states in the red.
In our communities, Virginians struggle to meet their individual needs with a $1,848 annual deficit. In Maryland, individuals do cover their annual grocery needs, but by a close margin of less than $5,000 ($4,738). When looking specifically at minimum wage workers, the deficits shoot up. Minimum wage earners in Virginia make $24,960 annually, so they’re short by $28,324. In Maryland, minimum wage earners make $31,200, so they’re at a deficit of $21,241. Finally, D.C. minimum wage earners are in the red by $16,392, because they only make $35,360.
Closing Thoughts
Beyond the numbers, these costs are real and felt by families and individuals alike, no matter if they earn the average income or are working for minimum wage. Regardless of status, state, or career, all people deserve access to comfortably feeding themselves.
United Way NCA is committed to fostering communities in the National Capital Area where every individual has access to health, education, and economic opportunity because no one should have to go without essential needs. Find out how you can help support our health and economic opportunity initiatives by taking action today.
Methodology
To determine how long residents in each state need to work to afford groceries, we collected the median annual income per person and per household from the most updated U.S. Census Bureau data. We also gathered the minimum wage annual income of each state from the U.S. Department of Labor. Then, we calculated the weekly and annual cost of groceries using the most recent U.S. Census Household Pulse Survey data. Finally, we calculated the percentage of take-home pay that should be spent on groceries based on Chase Bank’s personal finance benchmarks. We then synthesized this data to determine how many hours of work would be necessary to cover weekly and annual groceries, calculating annual deficits in the process.


