

The escalating expenses of childcare across the United States have emerged as an increasingly critical issue, surpassing even college tuition in certain regions. As daycare costs continue to soar, the weight of this burden disproportionately falls upon families of diverse racial backgrounds and income levels, exacerbating existing disparities.
In particular, black and brown communities, single parents, and very low-income households bear a disproportionate impact, as does the ALICE (Asset Limited, Income Constrained, Employed) population––those who earn more than the Federal Poverty Level, but less than the basic cost of living. Recognizing the gravity of the situation, the United Way of the National Capital Area identified the average annual childcare costs and the percentage of income spent on childcare in each state. From there, we analyzed how the childcare cost burden intensifies when considering different racial groups, household compositions, and low-income levels. Keep reading to see how your area measures up.
Where Are Average Childcare Costs the Highest?
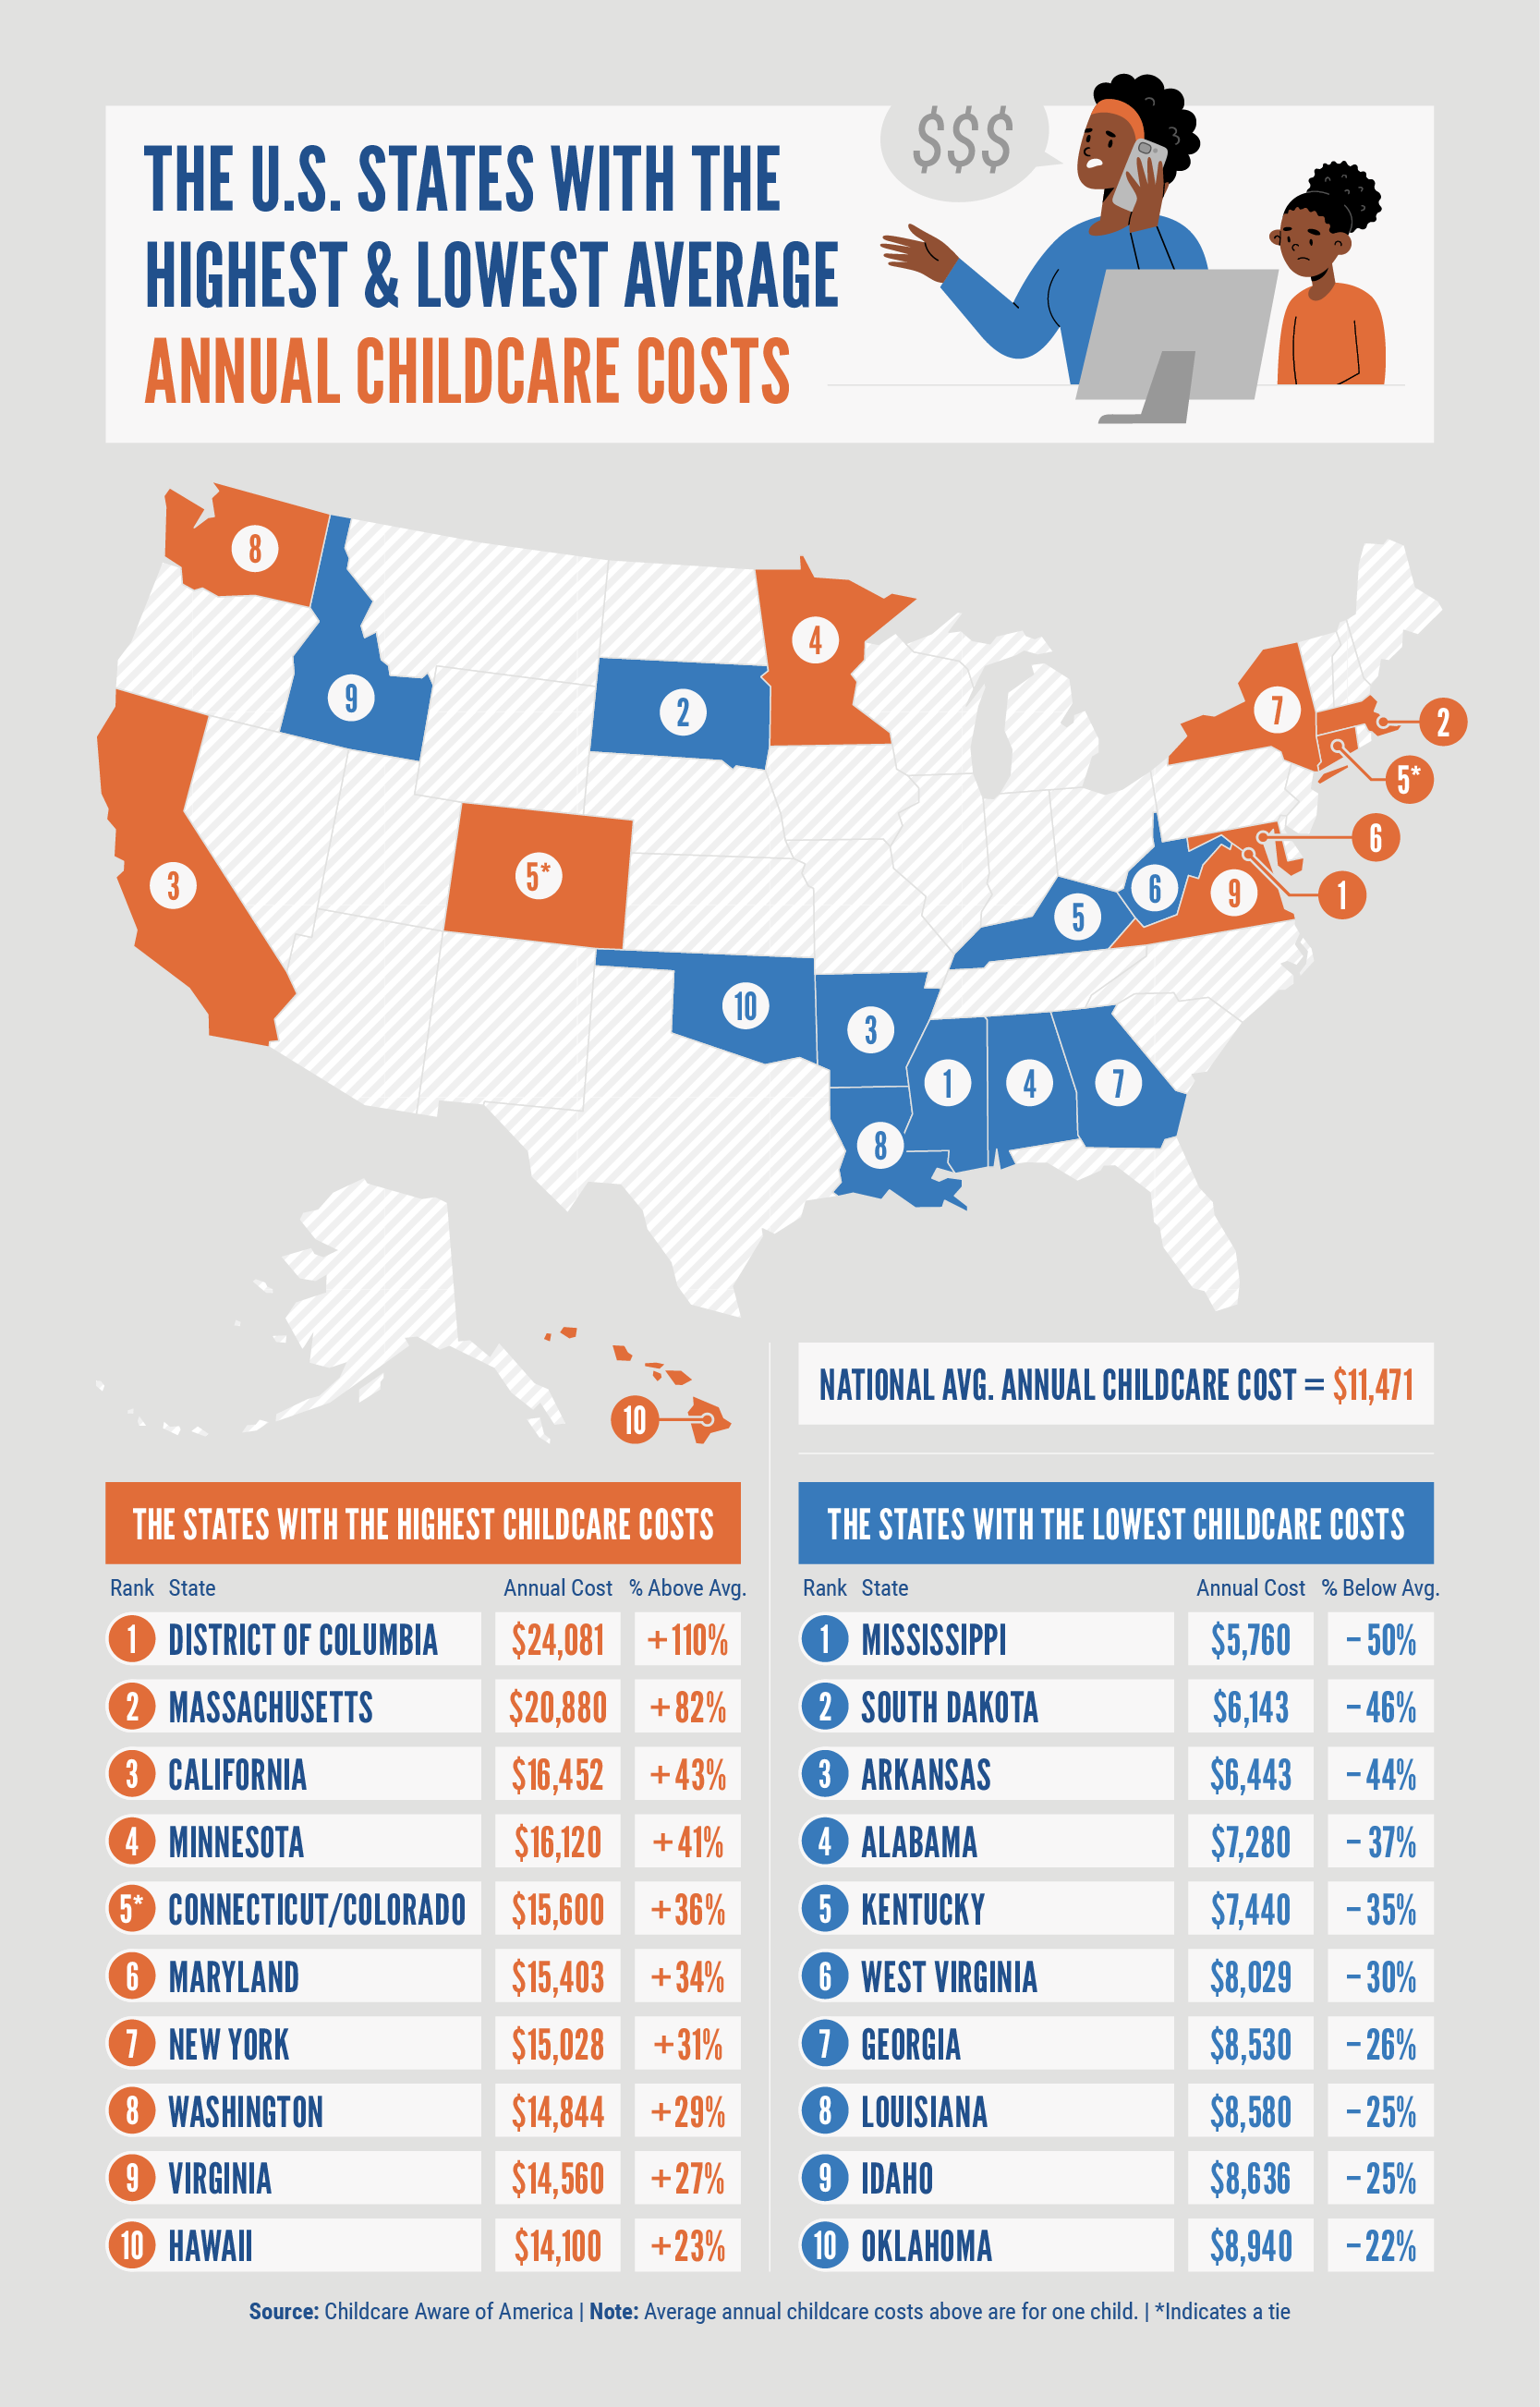
In the District of Columbia, the financial strain of childcare hits hard, as the average annual cost soars to a staggering $24,081 –– the highest in this study. This means that footing the bill for one year of childcare for a single child in D.C. comes close to matching the cost of four years’ tuition at a public college in the same area.
Further, according to United Way NCA’s 2023 ALICE report, a family of four in Washington D.C. (i.e., two adults, one infant, and one preschooler) can expect to pay at least $1,694 monthly on childcare. The average monthly rent in D.C. is $1,681 according to Census data. Therefore, paying for childcare each month costs more than paying monthly rent. Parents in D.C. and across the country are forced to make tough decisions like whether to pay for high-quality childcare or put a roof over their heads.
Taking the second and third spots are Massachusetts and California, where the average annual cost of childcare stands at $20,880 and $16,452, respectively. The burden of childcare costs is widespread, impacting families across various regions of the country.
In Maryland, families face an average annual childcare cost for one child of $15,403 — the 6th highest in the study. When we consider multiple children, the cost burden escalates. A family paying for childcare for two children in Maryland can expect to pay $1,538 monthly and $18,456 annually on childcare, according to the 2023 ALICE report. Average annual rent in Maryland averages $17,820, according to Census data, thus paying for childcare each year costs 3.5% more than paying a year’s worth of rent in MD.
Similarly, in Virginia, the average annual cost of childcare for one child amounts to $14,560 — the 9th highest in the study. The cost of one year of childcare for a single child in Virginia surpasses the annual tuition fees of prominent institutions such as George Mason University (GMU) ($13,401) and James Madison University (JMU) ($13,092), underscoring the financial challenges faced by parents in providing quality care for their children.
What’s more, the cost burden increases again when we look at households with multiple children in need of childcare in Virginia. A family paying for childcare for two children in VA can expect to pay at least $1,417 monthly and $17,004 annually on childcare, according to the 2023 ALICE report.
Where is the Childcare Cost Burden Highest?

District of Columbia
- Percentage of Income Spent on Childcare:
- Median Income: 25.7%
- Low Income (80% of Median Income): 32.2%
- Very Low Income (50% of Median Income): 51.5%
- Extremely Low Income (30% of Median Income): 85.8%
Massachusetts
- Percentage of Income Spent on Childcare:
- Median Income: 23.5%
- Low Income (80% of Median Income): 29.3%
- Very Low Income (50% of Median Income): 46.9%
- Extremely Low Income (30% of Median Income): 78.2%
Minnesota
- Percentage of Income Spent on Childcare:
- Median Income: 20.7%
- Low Income (80% of Median Income): 25.9%
- Very Low Income (50% of Median Income): 41.5%
- Extremely Low Income (30% of Median Income): 69.1%
Indiana
- Percentage of Income Spent on Childcare:
- Median Income: 20.0%
- Low Income (80% of Median Income): 25.0%
- Very Low Income (50% of Median Income): 40.0%
- Extremely Low Income (30% of Median Income): 66.7%
New York
- Percentage of Income Spent on Childcare:
- Median Income: 20.0%
- Low Income (80% of Median Income): 25.0%
- Very Low Income (50% of Median Income): 40.0%
- Extremely Low Income (30% of Median Income): 66.7%
This glaring disparity highlights the struggles of the ALICE (Asset Limited, Income Constrained, Employed) population –– those who earn more than the Federal Poverty Level (FPL) but still find themselves constrained by the rising cost of living within their area due to things like inflation and stagnant wages.Additionally, these households often don’t qualify for public assistance. For these families, the financial burden of childcare looms large, presenting a formidable challenge in achieving economic stability.
For example, the average household in D.C. will devote 26% of their annual income to childcare costs for one child. But for households earning below the ALICE threshold in D.C. (which includes both households in poverty and those that are ALICE, with income above the FPL but below the cost of basics) childcare costs can eat up 32% of their annual pay or more. And in D.C., 42% of households have income below the ALICE threshold, so a large chunk of the population is struggling to make ends meet when it comes to paying for childcare along with all of the other basic costs of living like housing, healthcare, and food, among other expenses.
Single parents are also severely burdened with childcare costs in D.C. Single parents will allocate 38% of their annual pay to childcare for one child in D.C. and single parents earning below the ALICE threshold will allocate 48% or more of their annual income.
Here’s what the results look like for other states in our National Capital Area. Virginia finds itself in the top 20 states and holds the 15th rank for having the highest childcare cost burden for low-income households. VA’s cost burden details are as follows:
Virginia
- Percentage of Income Spent on Childcare:
- Median Income: 18.1%
- Low Income (80% of Median Income): 22.6%
- Very Low Income (50% of Median Income): 36.1%
- Extremely Low Income (30% of Median Income): 60.2%
In Virginia, the average household will devote 18% of their annual income to childcare for one child. Low-income households will devote 23% or more, and single parents will devote 34%.
Maryland ranks 20th on the list of states with the highest childcare cost burden for low-income households. MD’s cost burden details are as follows:
Maryland
- Percentage of Income Spent on Childcare:
- Median Income: 16.8%
- Low Income (80% of Median Income): 21.1%
- Very Low Income (50% of Median Income): 33.7%
- Extremely Low Income (30% of Median Income): 56.2%
In Maryland, the average household will devote 17% of their annual income to childcare for one child. Low-income households will devote 21% or more, and single parents will devote 34%.
The Childcare Cost Burden by Race
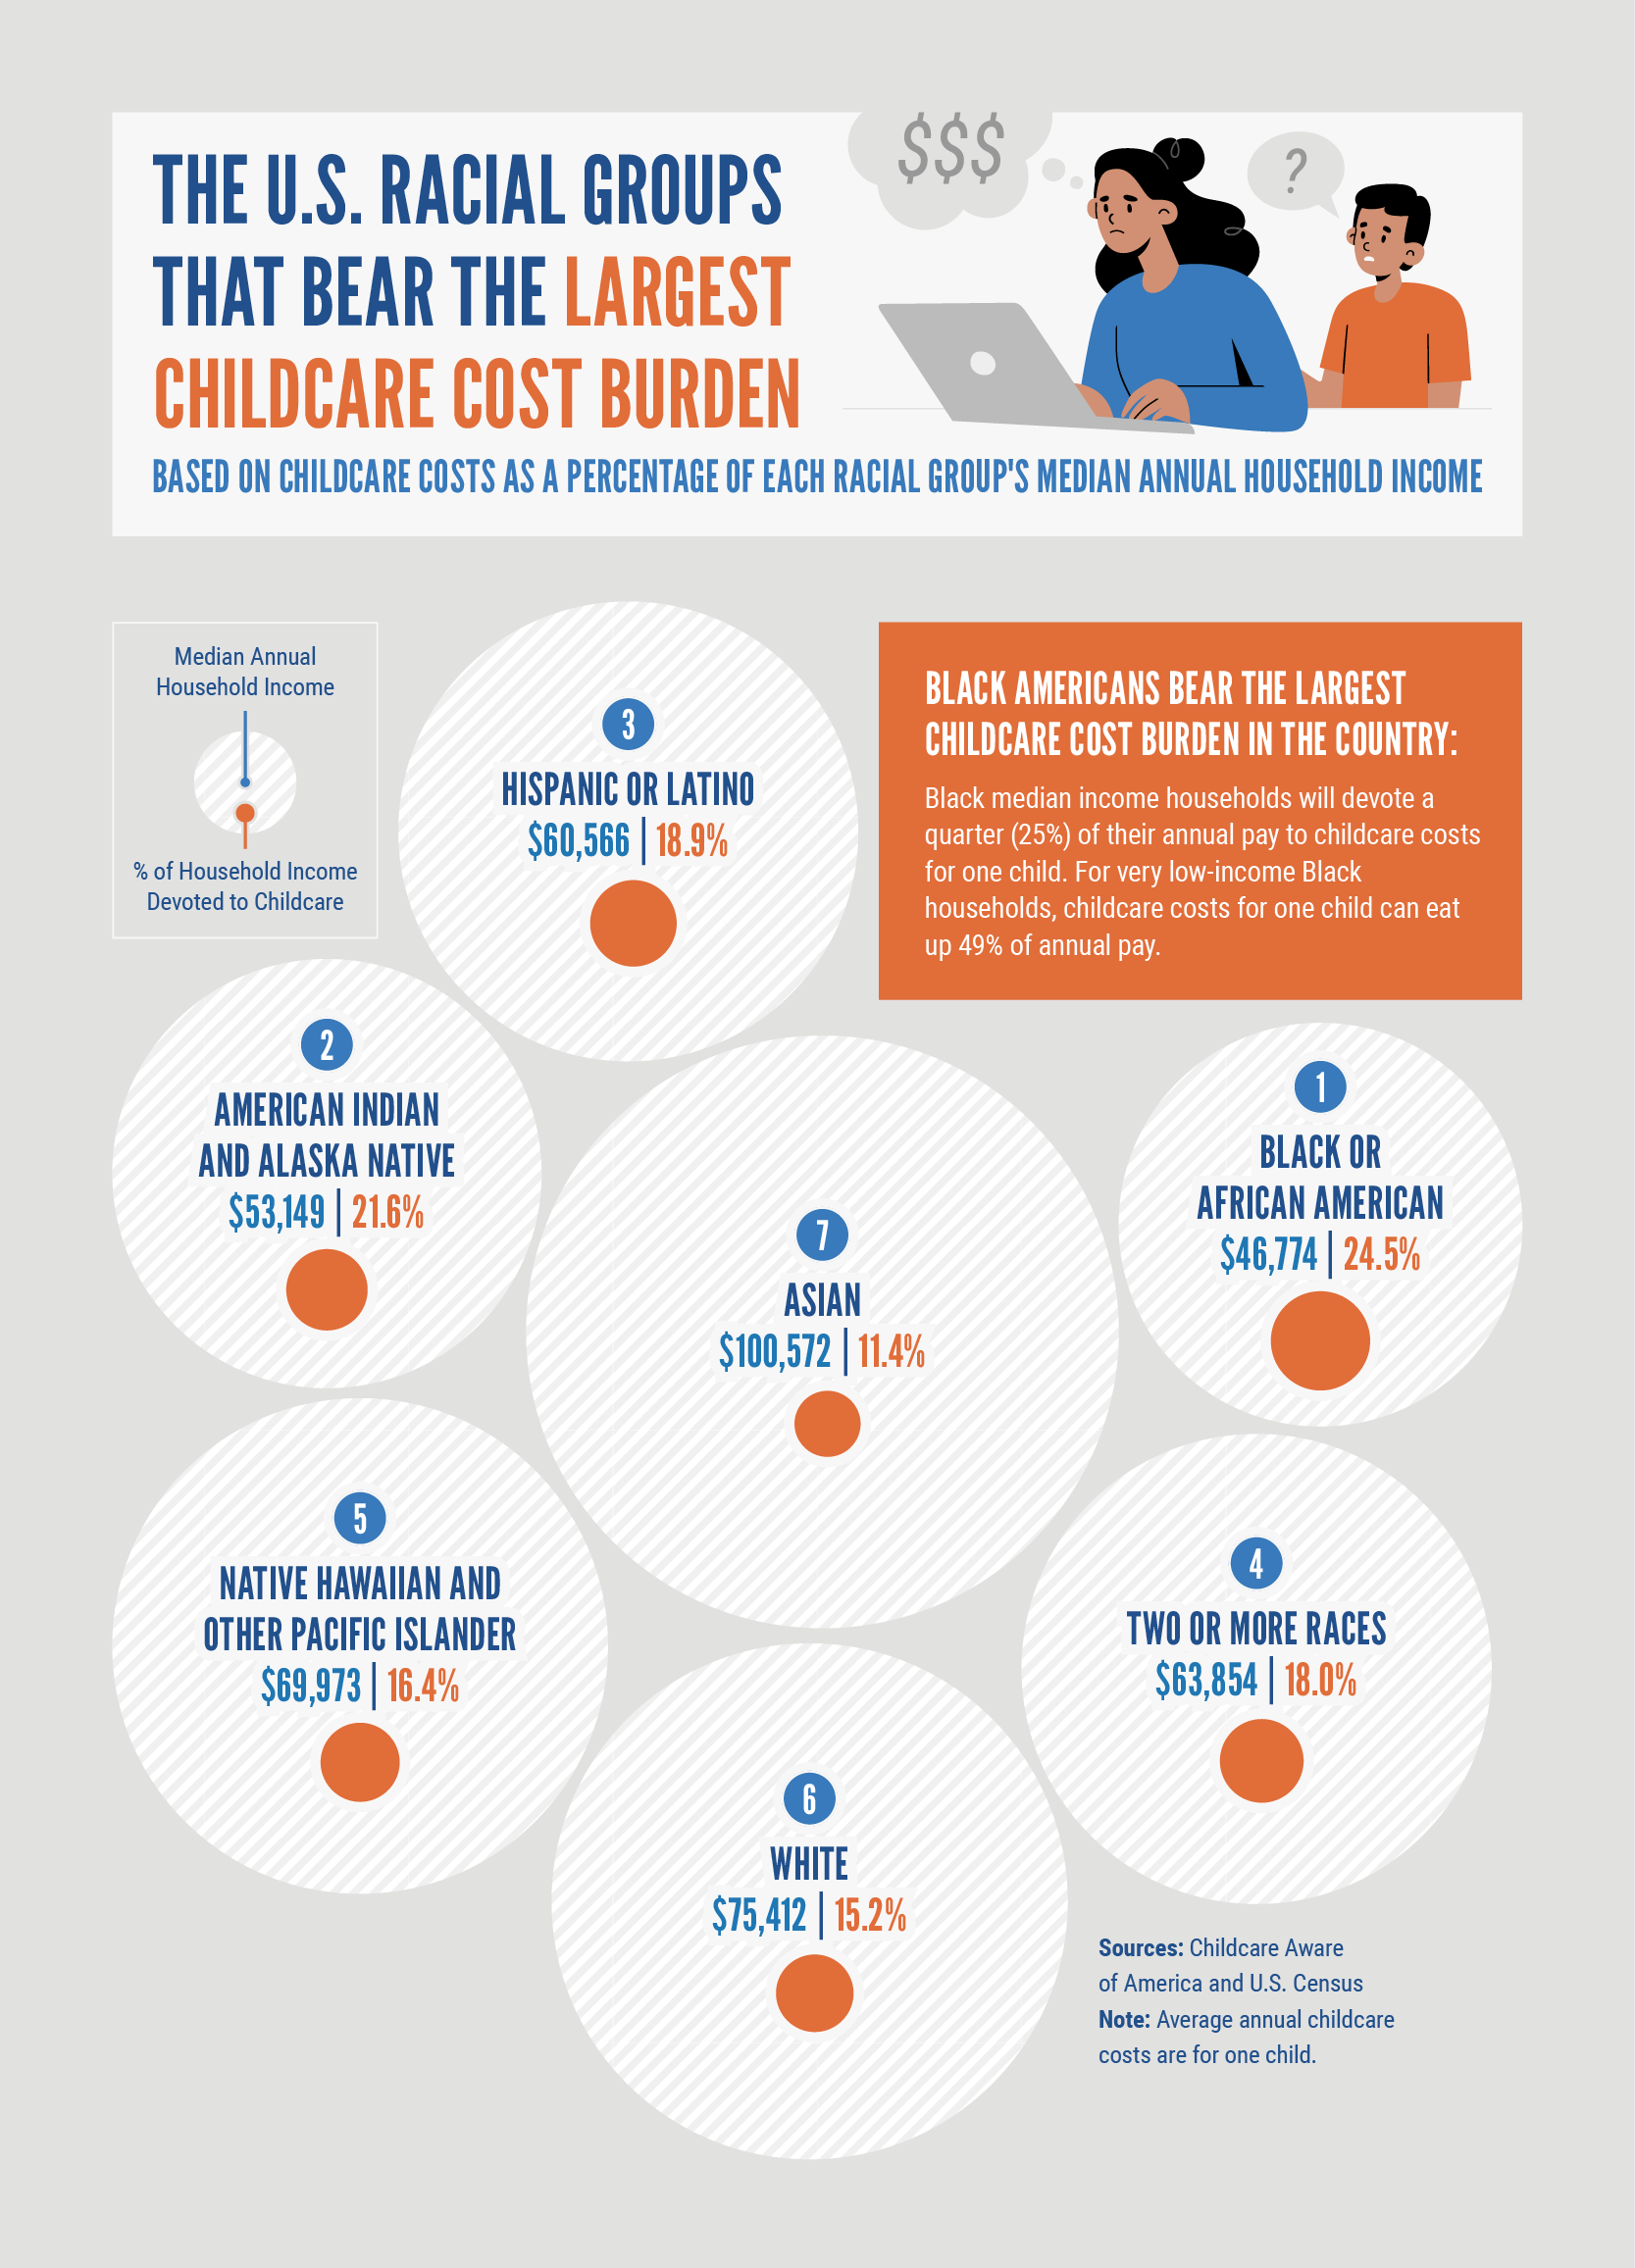
Rather than applying a broad brushstroke to the issue of childcare, we aimed to delve deeper and examine the disparities that exist based on race. We found that Black Americans have the highest childcare cost burden in the country. Black families experience the lowest median income among all racial groups, further underscoring the inequities pervasive in our society.
Black median-income households will spend a quarter (25%) of their annual pay ($46,774) on childcare for one child. For very low-income Black households, childcare costs for one child can eat up nearly half (49%) of their annual pay. On the opposite end, average white American households ($75,412) will devote 15%, and average Asian American households ($100,572) will devote only 11% of their annual pay to childcare.
Wisconsin emerges as the state with the largest daycare cost burden for Black Americans. Black median-income households in Wisconsin allocate over a third (35%) of their annual earnings to cover childcare costs for one child. With an average annual childcare cost of $12,552 and a median-income household for Black families at $36,379, this significant financial burden highlights the challenges faced by Black households in meeting childcare needs.
Massachusetts stands out as the state with the highest childcare cost burden for Hispanic or Latino Americans (39% of income devoted to childcare costs), American Indians, and Alaska Natives (35% of income devoted to daycare costs), as well as individuals identifying with two or more races (33% of income that covers daycare costs). The average annual childcare costs in Massachusetts amount to $20,880.
When we zoom in on our National Capital Area, we found that Black median-income households in D.C. will allocate 30% of their annual pay to childcare costs for one child –– a share that is 48% higher than their white counterparts. For Black households earning below the ALICE threshold in D.C., childcare costs can eat up 37% of their annual pay or more. 63% of Black households are below the ALICE threshold in D.C., so the majority of Black households are struggling with a heavy childcare cost burden.
Black median-income households in Virginia and Maryland will allocate 26% and 22% of their annual pay, respectively, to childcare costs for one child. For Black households earning below the ALICE threshold in VA, childcare costs can eat up 33% or more, and in MD, childcare costs can eat up 27% or more. For some households, these financial strains contribute to broader family instability that can increase vulnerability to systems like foster care.
Full Data
Looking to dive deeper into the numbers for your area? Use the interactive table below to sort by specific data categories or search for the state you call home.
Closing Thoughts
Rising childcare expenses pose substantial burdens on families throughout the U.S., with a disproportionate impact on BIPOC communities and low-income households. Access to affordable childcare is essential for all, regardless of race or background. If you find yourself struggling to pay for childcare and other bills, explore United Way NCA’s free financial coaching and empowerment services to get the support you need. At United Way, we believe that when none are ignored, all will thrive. Take action with United Way NCA and help support families facing financial hardship across the National Capital Area.
Methodology
To discover the childcare cost burden for low-income families around the U.S., we obtained the following data points:
- Average Annual Childcare Costs by State: Childcare Aware of America
- Median Annual Household Income by State: U.S. Census
- Median Annual Household Income by Race: U.S. Census
To find the childcare cost burden for families who earn below the median income, we utilized income thresholds defined by the U.S. Department of Housing and Urban Development. We considered three low-income levels:
- 80% of the median income (low income)
- 50% of the median income (very low income)
- 30% of the median income (extremely low income).
For each low-income level, we divided the average annual childcare cost by state by the corresponding annual income amount to determine the percentage of their annual income that is consumed by childcare costs.
To explore the childcare cost burden experienced by different racial groups, we found the median annual household income by race, nationally.
Next, we divided the national average annual childcare cost by the median annual household income for each race to determine the percentage of annual income allocated to childcare costs for each racial group.
To read the full United Way NCA 2023 ALICE reports and learn more about the financial burden that the ALICE population faces on a daily basis in the National Capital Area, visit unitedwaynca.org/alice.
Recent Posts


blog