The State of Affordable Housing Across the U.S.
The affordable housing crisis rages on this summer. The White House announced a plan to ease the burden of U.S. housing costs, amid growing inflation. According to the National Low Income Housing Coalition, on a national scale, “only 36 affordable and available rental homes exist for every 100 extremely low-income renter households.” In 2022, the affordable housing supply cannot meet the demand of low-income renters in every U.S. state.
What’s more, in certain metro areas, minimum-wage workers must work 80 or more hours per week and average-wage workers must work 50 or more hours per week to afford a humble, one-bedroom rental at fair market rent.
For this reason, United Way of the National Capital Area was motivated to find the U.S. cities with the largest and smallest affordable housing shortages. We analyzed the gap between affordable and available rental homes and the number of low-income renter households in 50-plus cities across the country, using data from the National Low Income Housing Coalition. Read on to see how your city stacks up.
Methodology
Using data from the National Low Income Housing Coalition (NLIHC), we found the following insights:
- U.S. cities with the largest and smallest affordable housing shortages
- U.S. cities with the most and least affordable rentals per 100 households
- The annual income required to afford a one-bedroom and two-bedroom rental in each city (at fair market rent)
- The hours both minimum wage and average wage workers need to work each week to afford a one-bedroom and two-bedroom rental in each city (at fair market rent)
We found the affordable housing deficit in 50 metropolitan statistical areas by calculating the difference between the number of affordable (and available) rental units and the number of very low-income rental households. In the context of the study, affordable housing is considered rental units that are affordable for very low-income households (i.e., households who earn anywhere from 0% to 50% of the area’s median income).
Affordable Housing: The Gap Between Supply & Demand

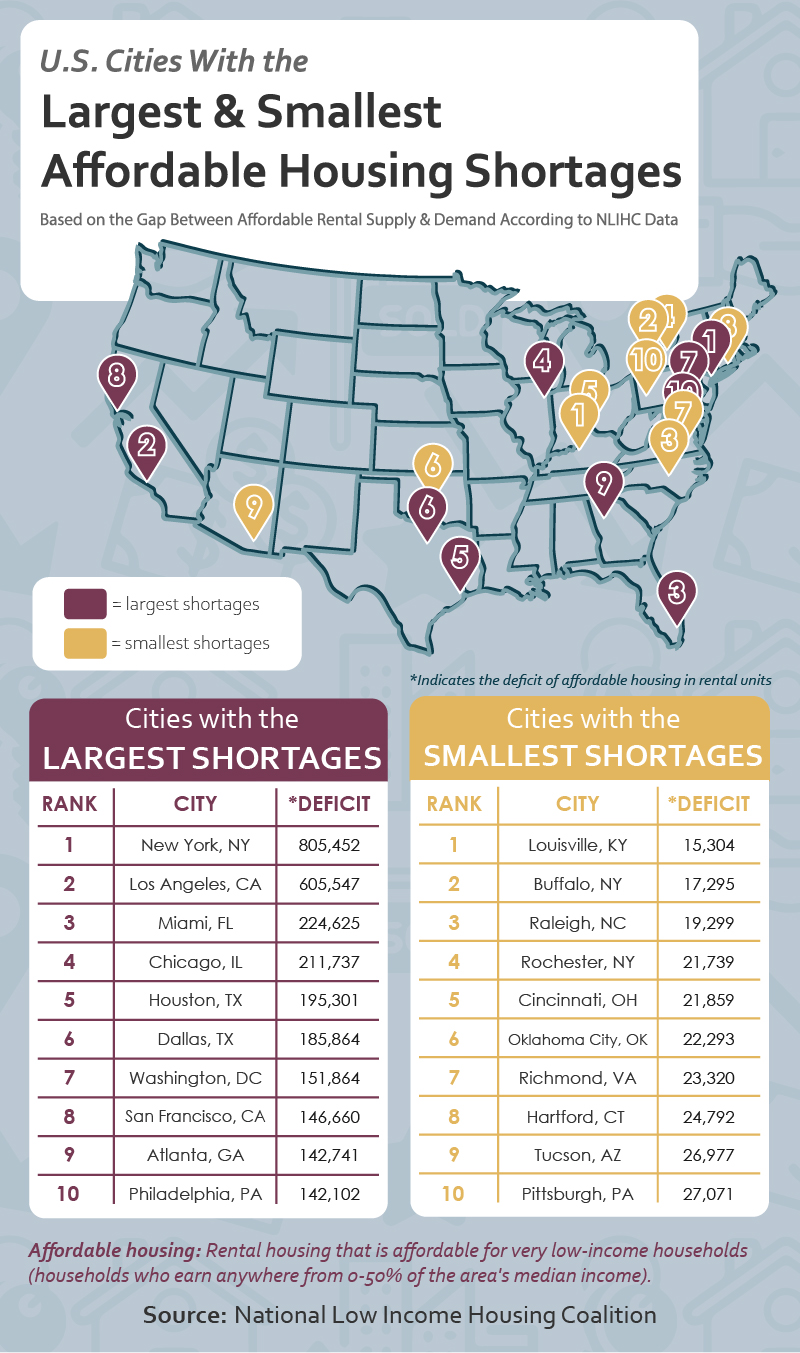
Currently, an affordable housing surplus is nonexistent across America’s largest cities. Every city above has a deficit in affordable housing; however, some cities are worse than others. New York, New York and Los Angeles, California are short by 600,000-plus affordable rental units, followed by Miami, short by over 224,000 rental units. Chicago, Illinois, Houston, Texas, Dallas, Texas and Washington, DC follow, where the affordable housing shortage exceeds 150,000 rental units.
The gap between affordable housing supply and demand is slimmer in Louisville, Kentucky, short by 15,300 rental units, and Buffalo, New York, short by 17,300 units.

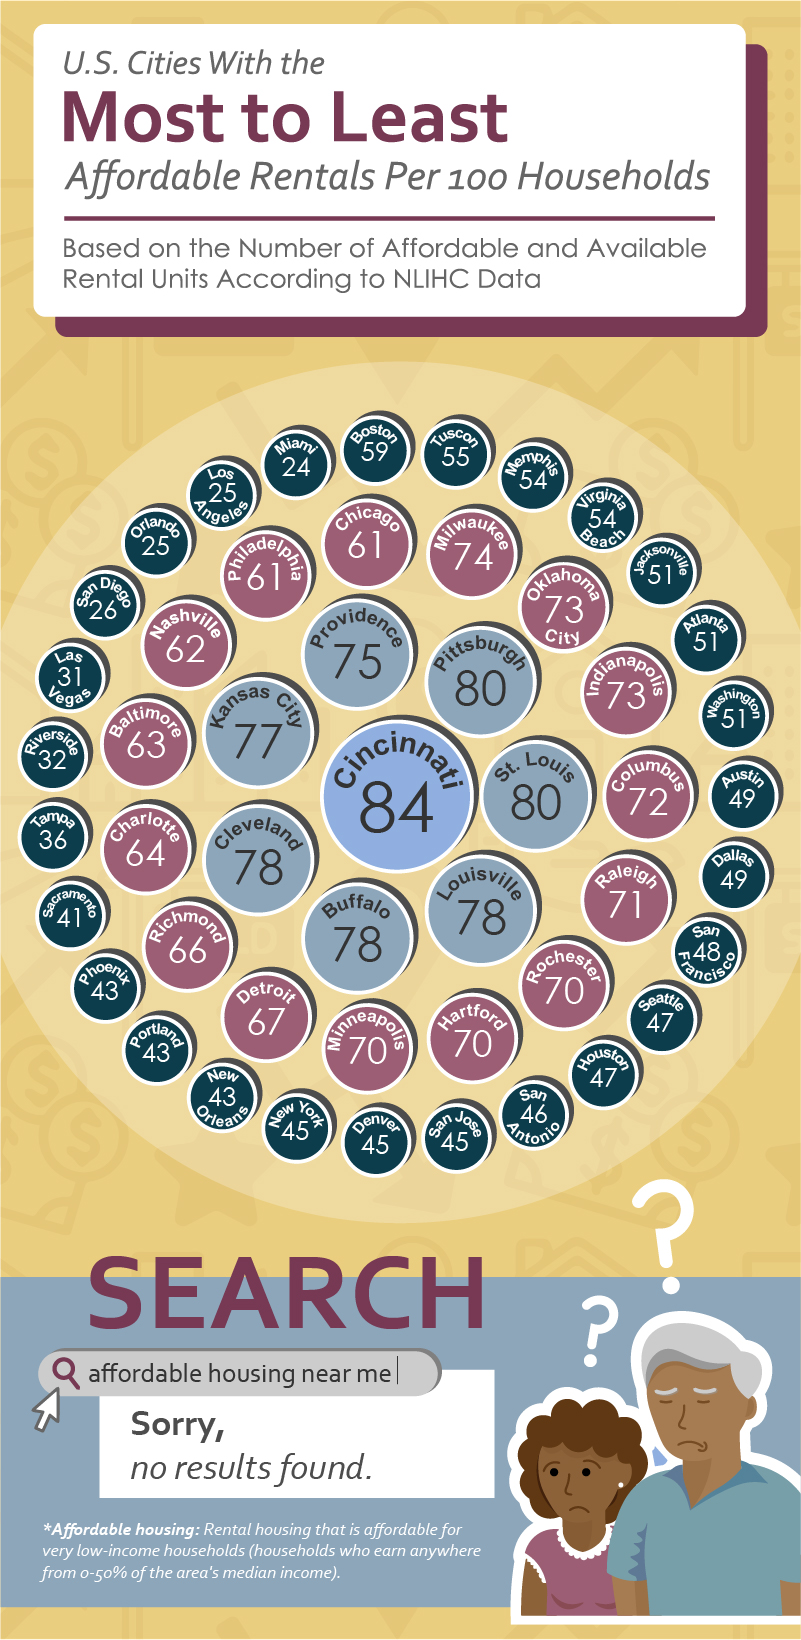
When we zoom in on the number of affordable and available rentals per 100 low-income renter households, the results shift. From this perspective, the housing burden in Miami, Florida is the highest, with only 24 affordable rental homes available per 100 low-income renter households. Further, higher population sizes don’t always equal greater housing burdens. Orlando, Florida, Riverside, California and Tampa, Florida are three cities with lower population sizes that have a significantly lower number of affordable rental homes per 100 low-income renter households––25, 32 and 36 affordable rental homes, respectively.
On the opposite end of the spectrum, the affordable housing market in Cincinnati, Ohio looks brighter with 84 affordable rentals per 100 low-income renter households. Pittsburgh, Pennsylvania and St. Louis, Missouri also rank high on this list, both at 80 affordable rentals per 100 households.
How Many Work Hours Are Required to Make Rent?
The interactive map above shows the hours both minimum-wage and average-wage workers need to work each week to afford a one-bedroom and two-bedroom rental in 50 of America’s largest cities at fair market rent.
Say goodbye to the 40-hour workweek. Average-wage workers in 47 of the 50 largest cities have to work more than 40 hours per week to afford a two-bedroom rental. In San Diego, California and Riverside, California, average wage workers have to work 55-plus hours per week to afford a one-bedroom rental and 70-plus hours per week to afford a two-bedroom rental. Only in Houston, Texas can average-wage workers afford a two-bedroom working under 40 hours per week.
When we look at minimum-wage workers, the housing situation gets dramatically worse. In only two cities, Buffalo, New York and Tucson, Arizona can minimum-wage workers afford a one-bedroom rental with under 50 hours worked per week. In Washington, DC, minimum-wage workers must work 78 hours per week on average to afford a modest, one-bedroom rental. In Orlando, Florida the number rises to 101 work hours per week, and in San Francisco, California the number skyrockets to 161 hours.
What Annual Income Is Required to Make Rent?
The interactive map above shows the annual income needed to afford a one-bedroom and two-bedroom rental in 50 of America’s largest cities at fair market rent.
San Francisco is one city in particular where the affordable housing crisis seems insurmountable. In San Francisco, renters need to earn over $116,000 per year to afford a modest, one-bedroom rental at fair market rent. But the average renter there makes $93,303 per year; thus, the average renter is short by almost $24,000. In the golden city, renters can barely afford a studio apartment with their annual salary, let alone a one-bedroom or two-bedroom rental.
Closing Thoughts
Rising rental costs place a growing strain on income-constrained communities around the U.S. Having adequate shelter is necessary for all. If you’re struggling to pay your rent and are concerned about eviction, help is available. Get help paying your rent using the methods here.


